Venue Network Intelligence · John F. Kennedy International.
Confidential client deliverable · Enter the passcode you were given
Imagine Wireless · Powered by OoklaConfidential
JFK · Rev 1 Baseline
Venue Network Intelligence Report · Deep Edition · Rev 1
Network baseline for John F. Kennedy International Airport across five operating terminals and a terminal-replacement program
Inside the terminal footprints T-Mobile leads 5 of 5 ranked terminals on the building-masked basis, while
the three carriers tie at the venue gate-area median and 75 of 134 gate points read weak for all three. Boingo Wireless is
the Port Authority's neutral-host DAS and Wi-Fi provider at JFK; the next step is Boingo's per-terminal coverage map,
with the section 13 building-masked criteria written into the New Terminal One and Terminal 6 designs. This report
measures where each carrier stands inside each terminal footprint, at the gate points, by band, and by serving cell,
so the in-building design under the terminal program can start from a documented baseline.
134
Gate points across five terminals · 137 OSM nodes, same-ref merge · every gate-carrier pair n ≥ 30 tiles
Gate-carrier pairs below the critical line (−110 dBm) · all AT&T
Prepared by the Imagine Wireless Network Intelligence Platform · Powered by Ookla
Data window 2025-09-01 to 2026-08-31 · Issued 2026-09-15 (rev 1) · Freshness 15 days at issue
Prepared for Port Authority of New York and New Jersey stakeholder review
Confidential
Section 1
Overview
Executive readout
Inside the terminal footprints (building-masked basis: 5G-reporting tiles inside the OSM terminal polygon,
healthy share of those, median), T-Mobile leads 5 of 5 ranked terminals: Terminal 1, Terminal 4, Terminal 5, Terminal 7,
Terminal 8. At the venue gate-area median the three carriers tie, all below the healthy line, and 75 of 134 gate
points read weak for all three. Verizon is best-5G at 16 of 16 Terminal 1 gate points and healthy at 14 of 16 on the
gate-area basis (counts, below the 30-gate floor; mean interior share 24%); the two bases describe different parts of
Terminal 1 and are both reported.
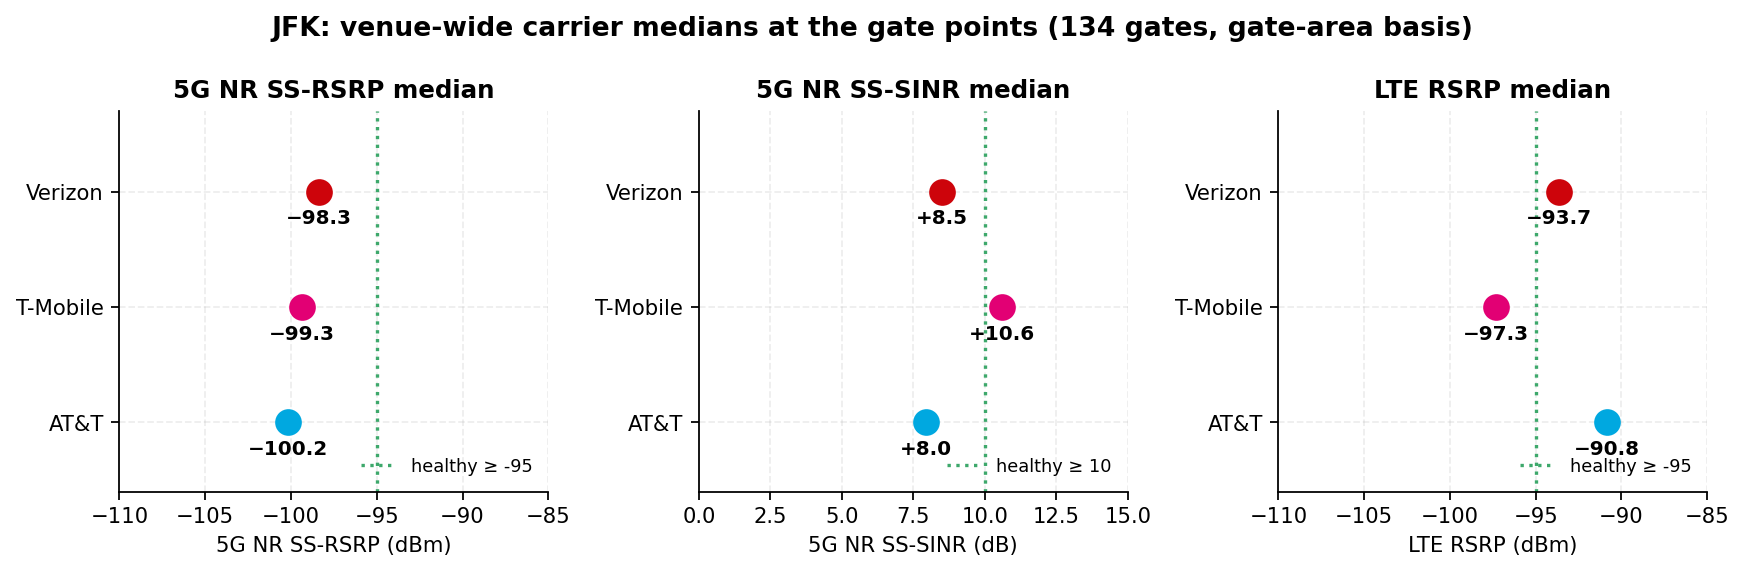
−98.3 dBm
Verizon gate-area median 5G RSRP · healthy at 24 of 134 gate points · critical at 0
−99.3 dBm
T-Mobile gate-area median 5G RSRP · healthy at 33 of 134 gate points · critical at 0
−100.2 dBm
AT&T gate-area median 5G RSRP · healthy at 9 of 134 gate points · critical at 12
Gate-area basis: mean of tiles within 80 m of the gate point, which straddles the apron. Adjacent margins 1.0 and 0.8 dB; the smaller is under the 1 dB noise floor, so the venue order is a tie.
Terminal leaders · building-masked · the capex lens
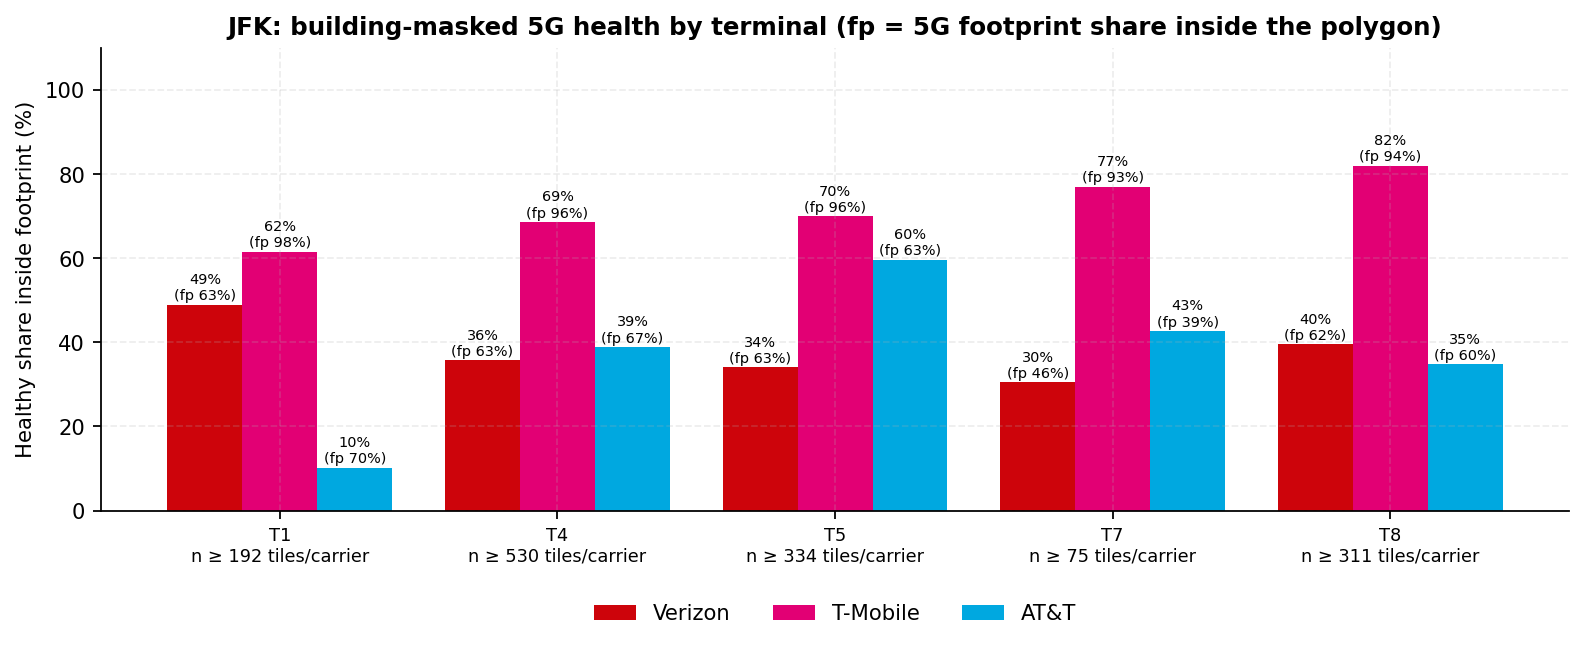
Decisive margins on the healthy share of 5G-reporting tiles inside each footprint (n ≥ 30 reporting tiles per
carrier; margins under 5 points are ties): Terminal 1 T-Mobile by 13 points; Terminal 4 T-Mobile by 30 points;
Terminal 5 T-Mobile by 10 points; Terminal 7 T-Mobile by 34 points; Terminal 8 T-Mobile by 42 points. Ties: none.
Count-only footprint: New Terminal One (under construction). Section 4 prints the full list once with n, footprint
share, healthy share, and median per carrier per terminal.
Verizon
Tied at the venue gate-area median; leads inside 0 of 5 terminal footprints (building-masked); best-5G at the
most gate points in Terminal 1, Terminal 4 and Terminal 8 (gate-area counts). Venue gate-area median −98.3 dBm, healthy at 24
of 134 gate points (18%), with a 5G signal-to-interference-plus-noise ratio (SINR) median of +8.5 dB (45 of 134 healthy).
It is best-5G at 54 of 110 decided gate points (24 more tied under the 1 dB floor, of 134 comparable) and best-LTE at 9 of 105 decided (29 more tied under the 1 dB floor) (LTE median −93.7 dBm, 78 of 134 healthy). It reports
5G on 59% of its on-airport tiles (panel-sensitive). Inside the footprints its healthy share of 5G-reporting tiles runs
30% to 49%.
T-Mobile
Tied at the venue gate-area median; leads inside 5 of 5 terminal footprints (building-masked); best-5G at the
most gate points in Terminal 5 and Terminal 7 (gate-area counts). Venue gate-area median −99.3 dBm,
healthy at 33 of 134 gate points (25%), with a 5G SINR median of +10.6 dB (71 of 134 healthy). It is best-5G at 44 of 110 decided gate points (24 more tied under the 1 dB floor, of 134 comparable) and best-LTE at 5 of 105 decided (29 more tied under the 1 dB floor) (LTE median −97.3 dBm, 35 of 134 healthy). It reports 5G on 78% of its
on-airport tiles (panel-sensitive). Inside the footprints its healthy share of 5G-reporting tiles runs 62% to 82%. Its
LTE layer is the weakest of the three.
AT&T
Tied at the venue gate-area median; leads inside 0 of 5 terminal footprints (building-masked); best-5G at the
most gate points in no terminal (gate-area counts). Venue gate-area median −100.2 dBm, healthy at 9 of 134 gate
points (7%), with a 5G SINR median of +8.0 dB (38 of 134 healthy). It is best-5G at 12 of 110 decided gate points (24 more tied under the 1 dB floor, of 134 comparable) and best-LTE at 91 of 105 decided (29 more tied under the 1 dB floor) (LTE median −90.8 dBm, 102 of 134 healthy). It reports 5G on 45% of its on-airport tiles
(panel-sensitive). Inside the footprints its healthy share of 5G-reporting tiles runs 10% to 60%. Its LTE layer is the
venue LTE network of record.
Which carrier is worst depends on the basis
On the gate-area basis, AT&T is the weakest carrier at 90 of 134 ranked gate points and holds all 12 critical gate
points (Verizon 0, T-Mobile 0, AT&T 12). Inside the footprints on the panel-sensitive present-and-healthy share,
Verizon is the weakest carrier in 3 of 5 terminals; on the building-masked conditional share the weakest carrier is
AT&T in T1, Verizon in T4, Verizon in T5, Verizon in T7, AT&T in T8. The capex lens is the building-masked
conditional view: it is the only lens in the export that reads the buildings rather than the apron, and it is
the basis for sections 13 and 14.
What this report measures
Every ranking is signal-layer: RSRP and SINR from an Android crowdsource panel. The export contains no throughput or
latency, so it measures where signal is. It does not measure whether a call or app fails, and a strong-signal
network can still be congested. Gate-area values are tiles within 80 m of a gate point: on average 28% of those
tiles lie inside a terminal footprint (by terminal: T1 24%, T4 22%, T5 33%, T7 41%, T8 30%) and the rest are apron
and stand. The building-masked view is the only lens that reads the buildings; nothing in this report is measured
indoors and there is no Z-axis.
Provider of record
Boingo Wireless is the Port Authority's neutral-host DAS and Wi-Fi provider at JFK (Boingo press release, October 14, 2025, held; PANYNJ board authorization, June 26, 2025, Imagine knowledge graph; Airport DAS Master, July 2026, Imagine knowledge graph)Tier B · held: the agreement was authorized on June 26, 2025 under the 2024 RFP, announced on October 14, 2025 as a long-term agreement to deliver next-generation cellular and free public Wi-Fi across Port Authority properties including JFK, runs 2026 to 2038, and replaces the 1999 New York Telecom Partners agreement under which Boingo already operated at JFK; Boingo also provides Passpoint Wi-Fi at JFK. The remaining question is Boingo's per-terminal
coverage map (section 9, recommendation 1). This report reads the tiles as what the passenger experiences on the
Boingo-served venue.
Section 2
Venue and terminal-program context
Asset inventory · construction record
JFK is operated by the Port Authority of New York and New Jersey. The record we hold describes a large hub with
five operating terminals, Boingo Wireless as the neutral-host DAS and Wi-Fi provider of record, and a terminal program that
replaces two of the measured buildings. Measured facts in this report stand on the tile export alone; public-record
facts are tagged inline and never originate a measurement.
Element
Value
Notes
Airport
John F. Kennedy International Airport (JFK / KJFK)
62.6 million passengers in 2025, a 1.0 percent decrease from its 2024 record of 63.3 million (Port Authority of New York and New Jersey press release, facility volumes for December and full-year 2025) cited source
Operating authority
Port Authority of New York and New Jersey
Neutral-host DAS and Wi-Fi provider: Boingo Wireless (Tier B, held press release + Imagine knowledge graph). Named contacts in the graph: Beth Rooney (Director, Port); Jacquelene McCarthy (Director, Aviation Redevelopment); Michael Wojnar (Special Counselor to the Executive Director); Sarah McKeon (Director, Aviation) Imagine knowledge graph · cited source
Terminals analyzed
5 · T1, T4, T5, T7, T8
T1 Air France, Korean Air, Lufthansa, SWISS, Turkish Airlines · T4 Delta Air Lines · T5 JetBlue Airways · T7 Air Canada, Aer Lingus, ANA, Icelandair, Frontier, Norse Atlantic · T8 American Airlines (Tier B). Terminal 2 has been demolished and has no footprint in OpenStreetMap; New Terminal One (NTO) is not open in the measurement window
Tile basis
95,364 carrier-tile records over 50,923 unique tiles · 50,663 usage tiles
Clipped to the KJFK aerodrome polygon plus 200 m from 120,686 exported records and 65,263 usage tiles · window 2025-09-01 to 2026-08-31
Gate points
134 · 402 gate-carrier pairs
137 OpenStreetMap (OSM) gate nodes pinned 2026-09-15; same-ref nodes within 30 m merged (T4 A6 from 3 nodes; T4 A7 from 2 nodes) · T1 16 · T4 47 · T5 29 · T7 10 · T8 32; one gate carries no ref. Refs repeat across terminals, so every gate is named by terminal and ref
Boingo Wireless neutral-host DAS and Wi-Fi (provider of record, Tier B)
Boingo Wireless is the Port Authority's neutral-host DAS and Wi-Fi provider at JFK (Boingo press release, October 14, 2025, held; PANYNJ board authorization, June 26, 2025, Imagine knowledge graph; Airport DAS Master, July 2026, Imagine knowledge graph); the agreement was authorized on June 26, 2025 under the 2024 RFP, announced on October 14, 2025 as a long-term agreement to deliver next-generation cellular and free public Wi-Fi across Port Authority properties including JFK, runs 2026 to 2038, and replaces the 1999 New York Telecom Partners agreement under which Boingo already operated at JFK; Boingo also provides Passpoint Wi-Fi at JFK. DAS: yes · self-owned: no · neutral host: yes · operator Boingo · equipment OEM unknown (Airport DAS Master, reconciled July 28, 2026) Imagine knowledge graph. Open item: Boingo's per-terminal coverage map (section 9, recommendation 1)
Construction program
New Terminal One and Terminal 6
New Terminal One: $9.5 billion, 23 gates, on the Terminal 1 site and the former Terminals 2 and 3 site; not open in the measurement window; the first phase is now expected in early 2027. Terminal 6: $4.2 billion, 10 gates, first gates expected in late 2026, replacing the former Terminal 6 and eventually Terminal 7. Program total about $19 billion. Alaska Airlines moved from Terminal 7 to Terminal 8 in October 2025 cited source
Knowledge-graph coverage
Record held (pinned 2026-09-16)
Large hub; 30,792,806 calendar-year enplanements (year as recorded in the graph); Boingo neutral-host DAS and Passpoint rows; four leadership rows; the contracts query and the artifact search failed at the pull; per-terminal DAS scope and carrier participation are not in the graph Imagine knowledge graph · cited source. Enplanements and two-way passengers are different counts and neither is distributed across gates here
Export extent
Aerodrome east strip unexported
The export rectangle stops at longitude −73.7618, so the aerodrome's eastern strip (the runway 4L/22R end and the east cargo area) carries no tiles; no terminal sits in that strip
Macro-site layer
Queued
Macro-site geometry (Ookla Site Finder centroids) is queued for the next revision
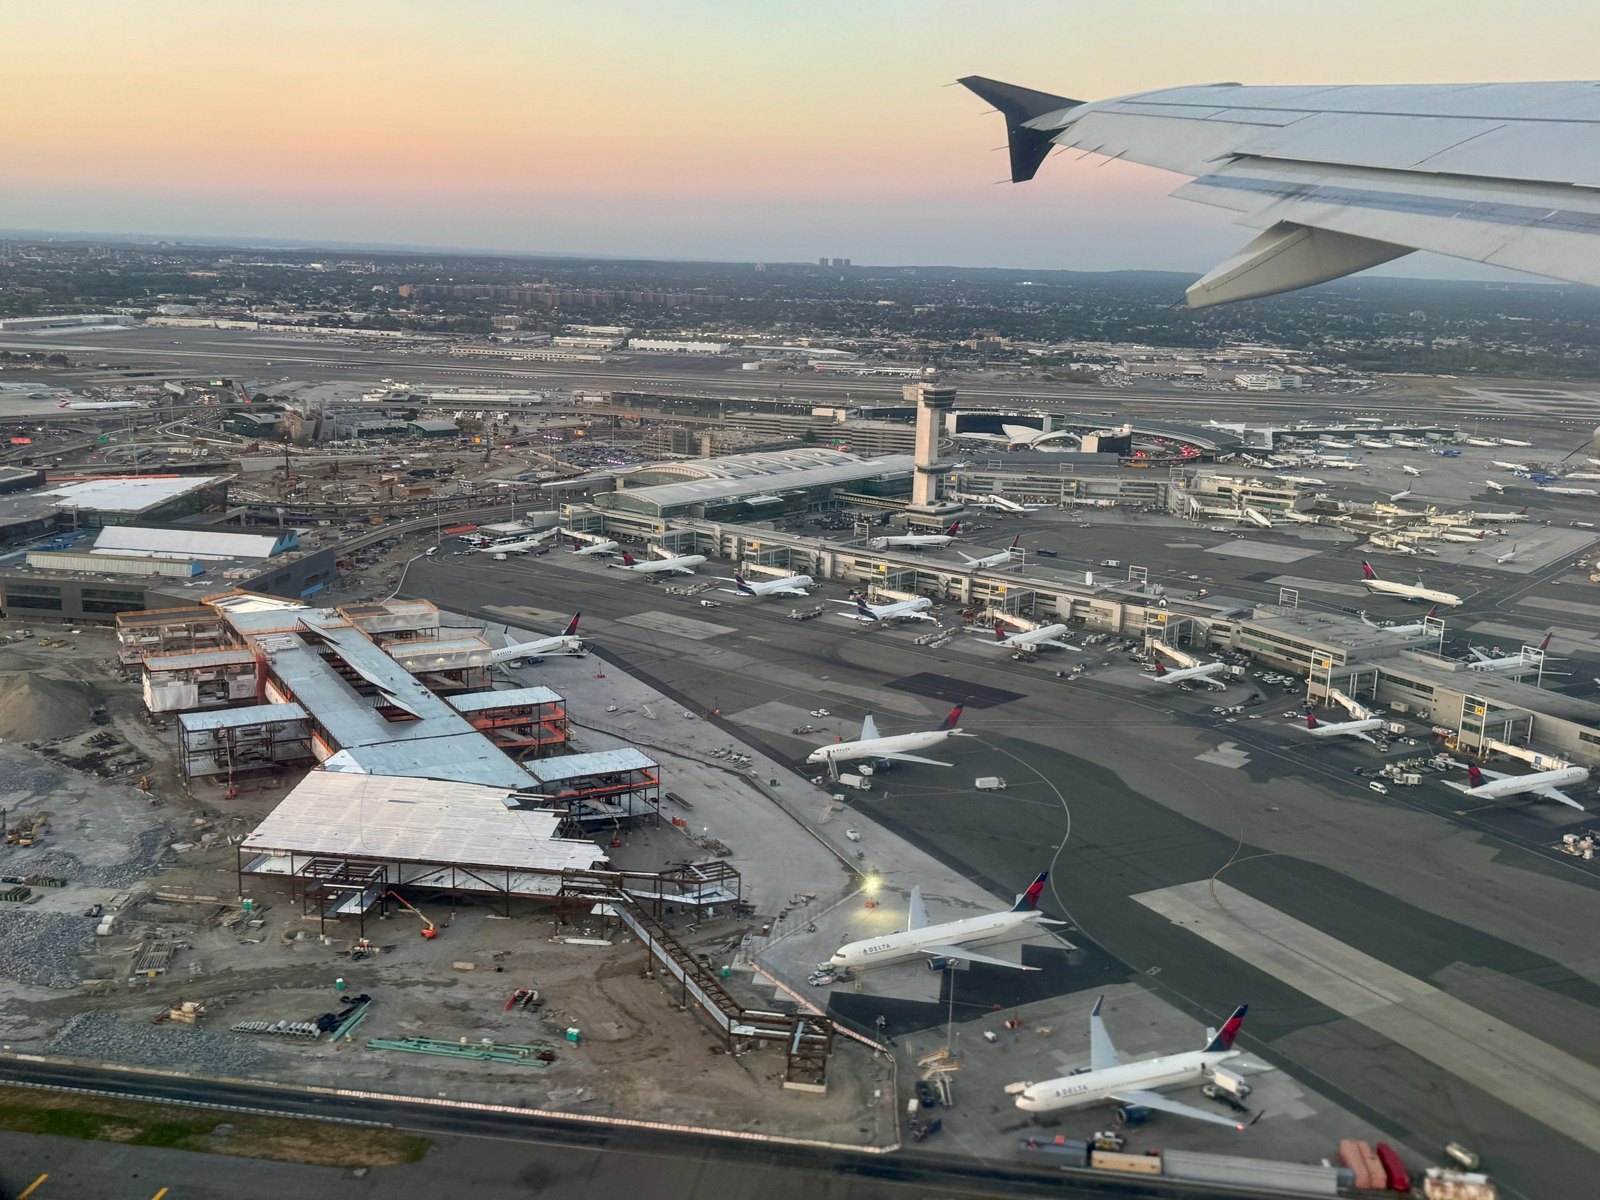
Photo · Terminal 4 apron and gates, September 2024Wikimedia Commons
Photo: Oleg Yunakov, CC0 (2024-09-15), via Wikimedia Commons. Illustrative (Tier B), resized only; the photograph is not a measurement.
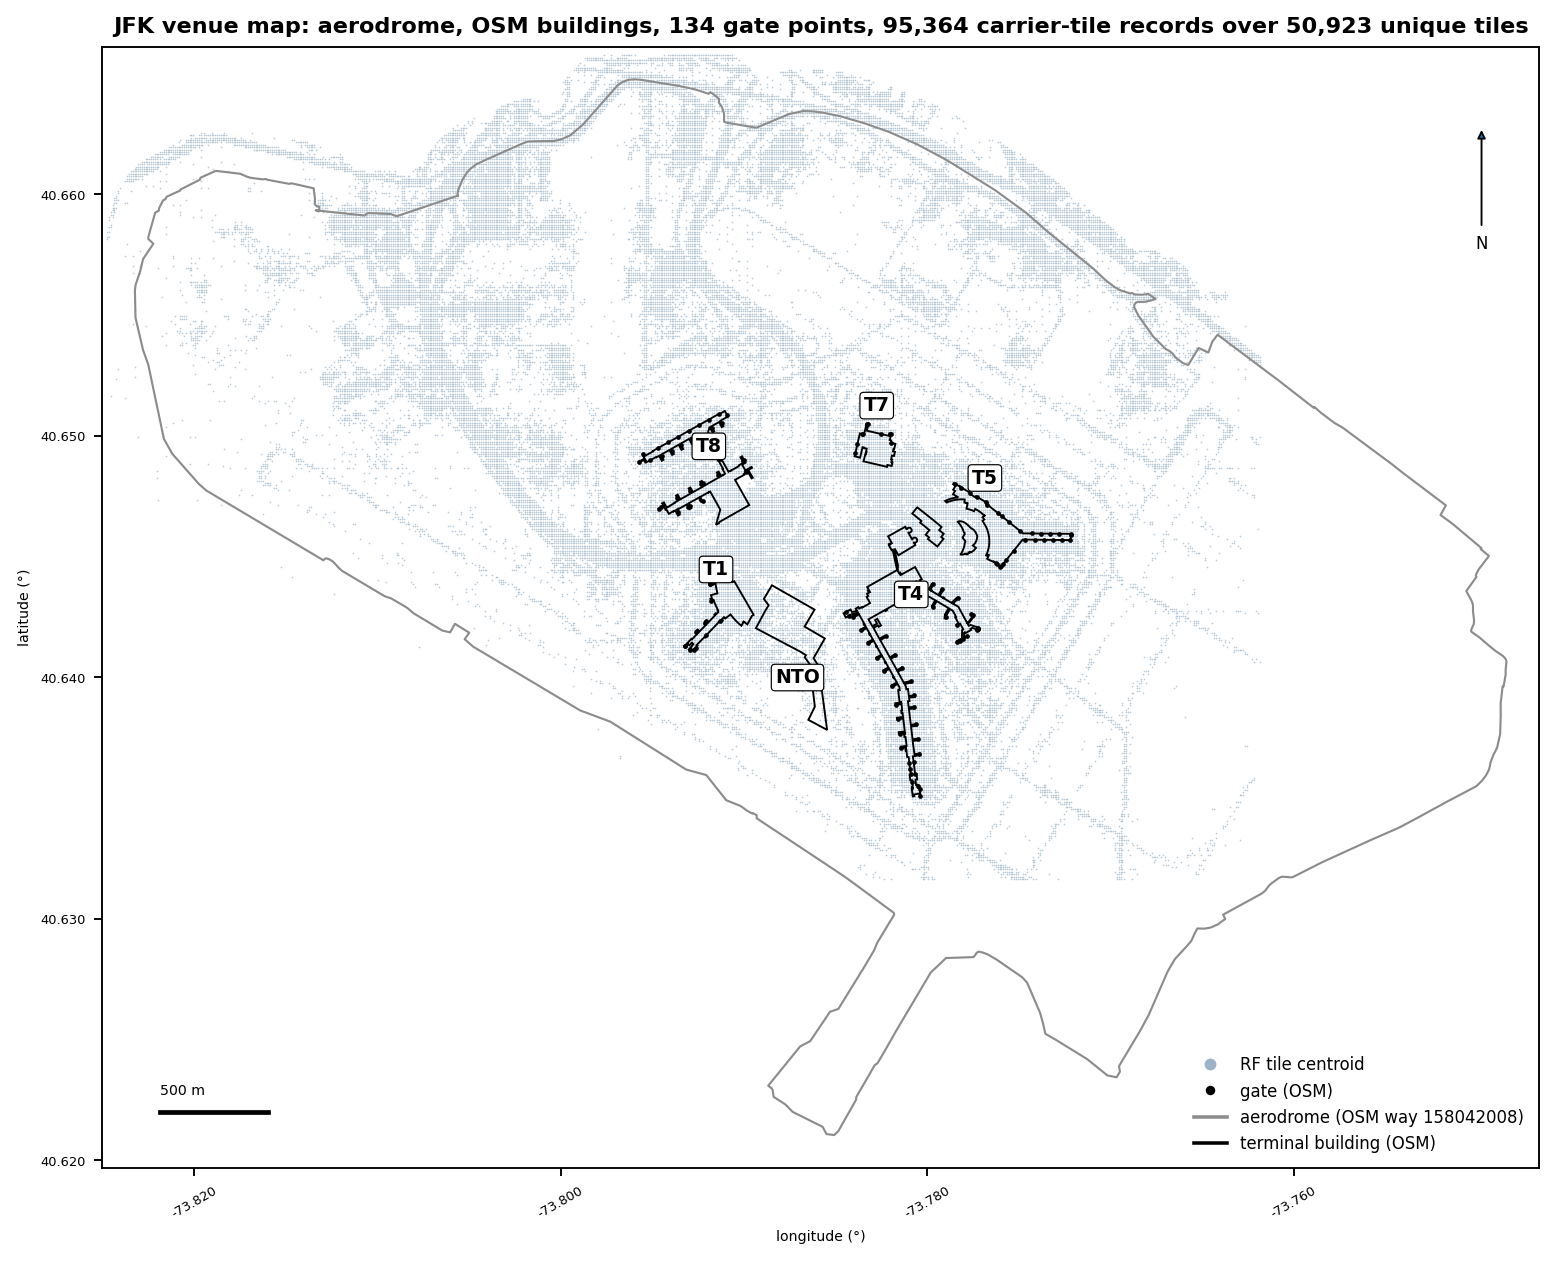
Aerodrome = OSM way 158042008 plus 200 m clip. NTO is New Terminal One, under construction. North up; scale bar in meters. The east strip beyond the export rectangle carries no tiles. Source: Ookla Cell Analytics tiles on OpenStreetMap geometry. Window 2025-09-01 to 2026-08-31.
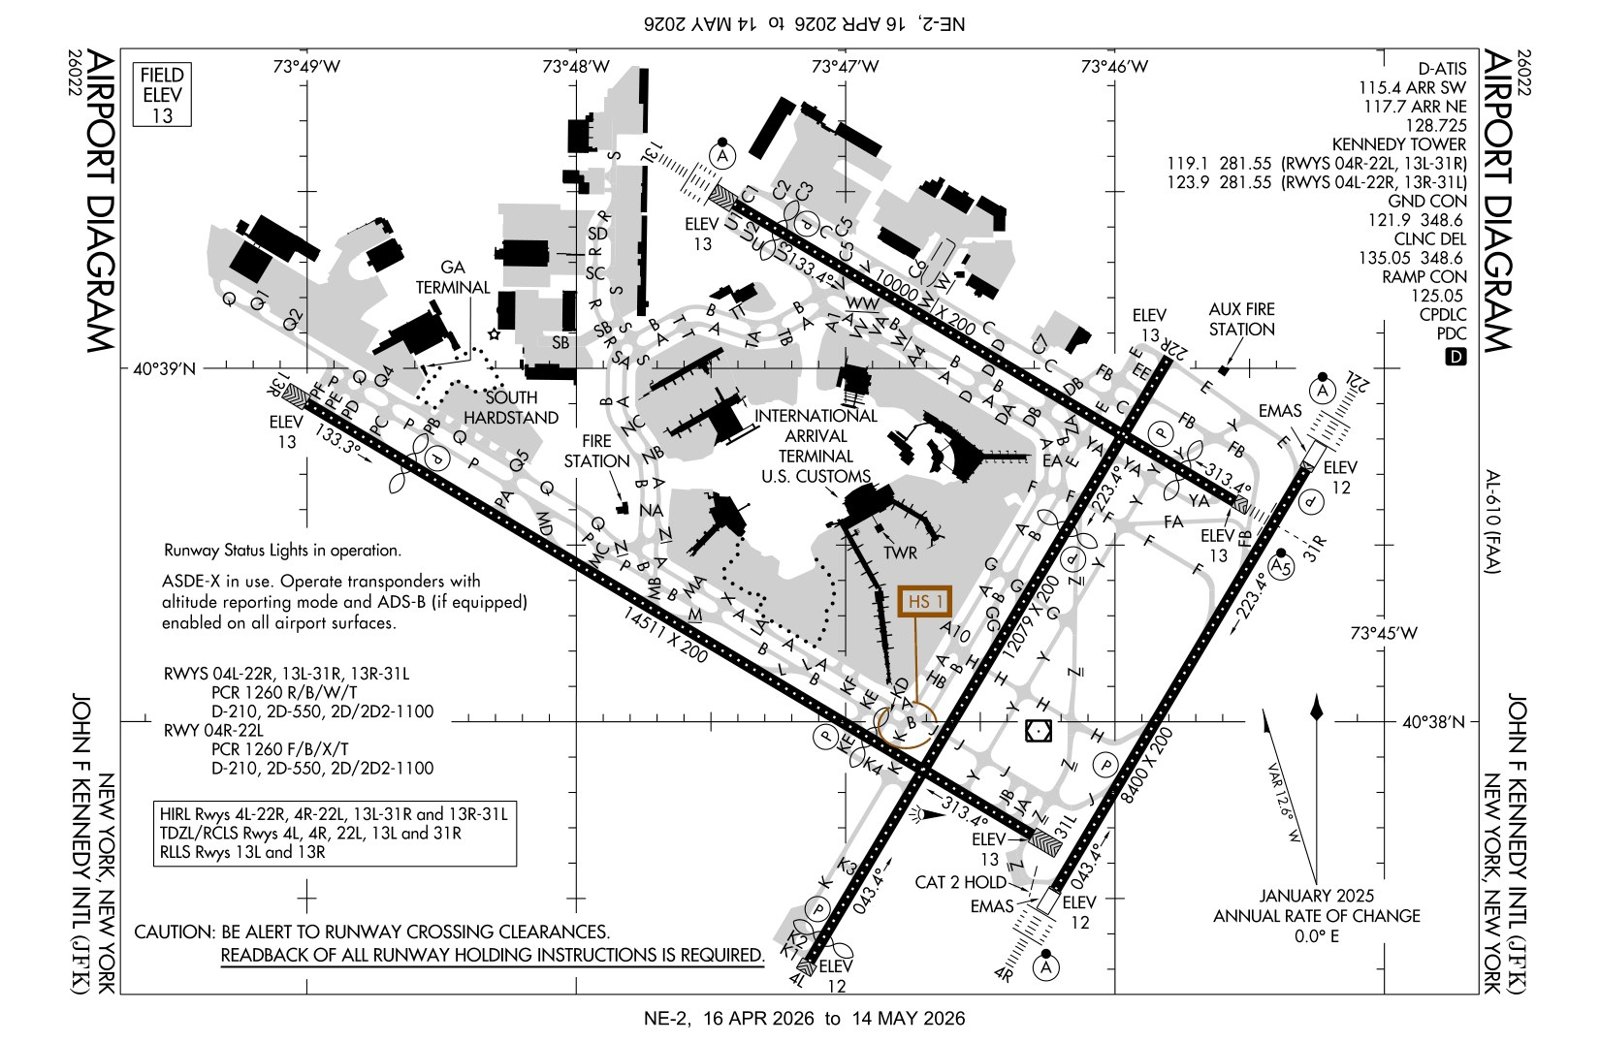
FAA airport diagram · reproduced for orientationWikimedia Commons
Federal Aviation Administration, Public domain (2025-01-01), via Wikimedia Commons. It is the FAA's drawing, not this report's geometry; runway and taxiway labels come from the FAA.
Gate-area basis · presentation order, not a ranking
Carriers are printed strongest at the gate points first (Verizon, T-Mobile, AT&T), asserted against the
data at build time. Each gate-area value is the arithmetic mean of tiles within 80 m of the gate point, which straddles
the apron; the venue value is the median across the 134 gate points. Every published gate-carrier pair has at least 30
tiles. Per-gate best-carrier calls use the same 1 dB floor: a carrier is named only when its top-two margin reaches 1 dB, and smaller margins print as a tie with the margin (24 tied on 5G NR, 29 on LTE, of 134 comparable gate points). The adjacent margins (1.0 and 0.8 dB) are under the 1 dB noise floor, so the venue order is a presentation
order, not a ranking.
Carrier
Gate-area median 5G
Healthy gate points (5G)
At risk
Critical
Best 5G
Best LTE
Median SINR
Gate-area median LTE
Verizon
−98.3 dBm
24 / 134
110
0
62 / 134
19 / 134
+8.5 dB
−93.7 dBm
T-Mobile
−99.3 dBm
33 / 134
101
0
54 / 134
6 / 134
+10.6 dB
−97.3 dBm
AT&T
−100.2 dBm
9 / 134
113
12
18 / 134
109 / 134
+8.0 dB
−90.8 dBm
Healthy = gate-area mean ≥ −95 dBm; n = 134 gate points per carrier. SINR healthy (≥ 10 dB): Verizon 45, T-Mobile 71, AT&T 38 of 134.
LTE healthy gate points: AT&T 102, Verizon 78, T-Mobile 35 of 134. Full per-gate tables ship in the PDF appendices.
5G footprint and conditional medians (tile basis)
Carrier
5G footprint (% of tiles, panel-sensitive)
5G RSRP median over reporting tiles
LTE RSRP median
LTE-only tiles
5G present and healthy (% of all tiles, panel-sensitive)
n (tiles)
Verizon
59%
−96.0 dBm
−95.0 dBm
38%
30%
28,746
T-Mobile
78%
−100.0 dBm
−98.0 dBm
20%
28%
43,109
AT&T
45%
−94.0 dBm
−93.0 dBm
53%
25%
23,509
Each 5G median is conditional on the tile reporting a 5G reading; the footprint share is panel-sensitive (a no-reading tile may be a panel gap on that carrier). n counts tiles, not scans.
AT&T's two layers diverge more than the other carriers'. Its LTE median at the gate points is −90.8 dBm (102
of 134 healthy) against a 5G median of −100.2 dBm, and 53% of its on-airport tiles carry only an LTE reading. Inside
the footprints its 5G footprint share is T1 70%, T4 67%, T5 63%, T7 39%, T8 60% against T-Mobile's 98%, 96%, 96%, 93%,
94%, so where AT&T reports 5G it is a smaller, strong-signal subset; its healthy share of reporting tiles is 10% to
60%. Its weakest footprint is Terminal 1 (10% healthy of n=226 reporting tiles, median −109.0 dBm), a building that the
New Terminal One program replaces cited source.
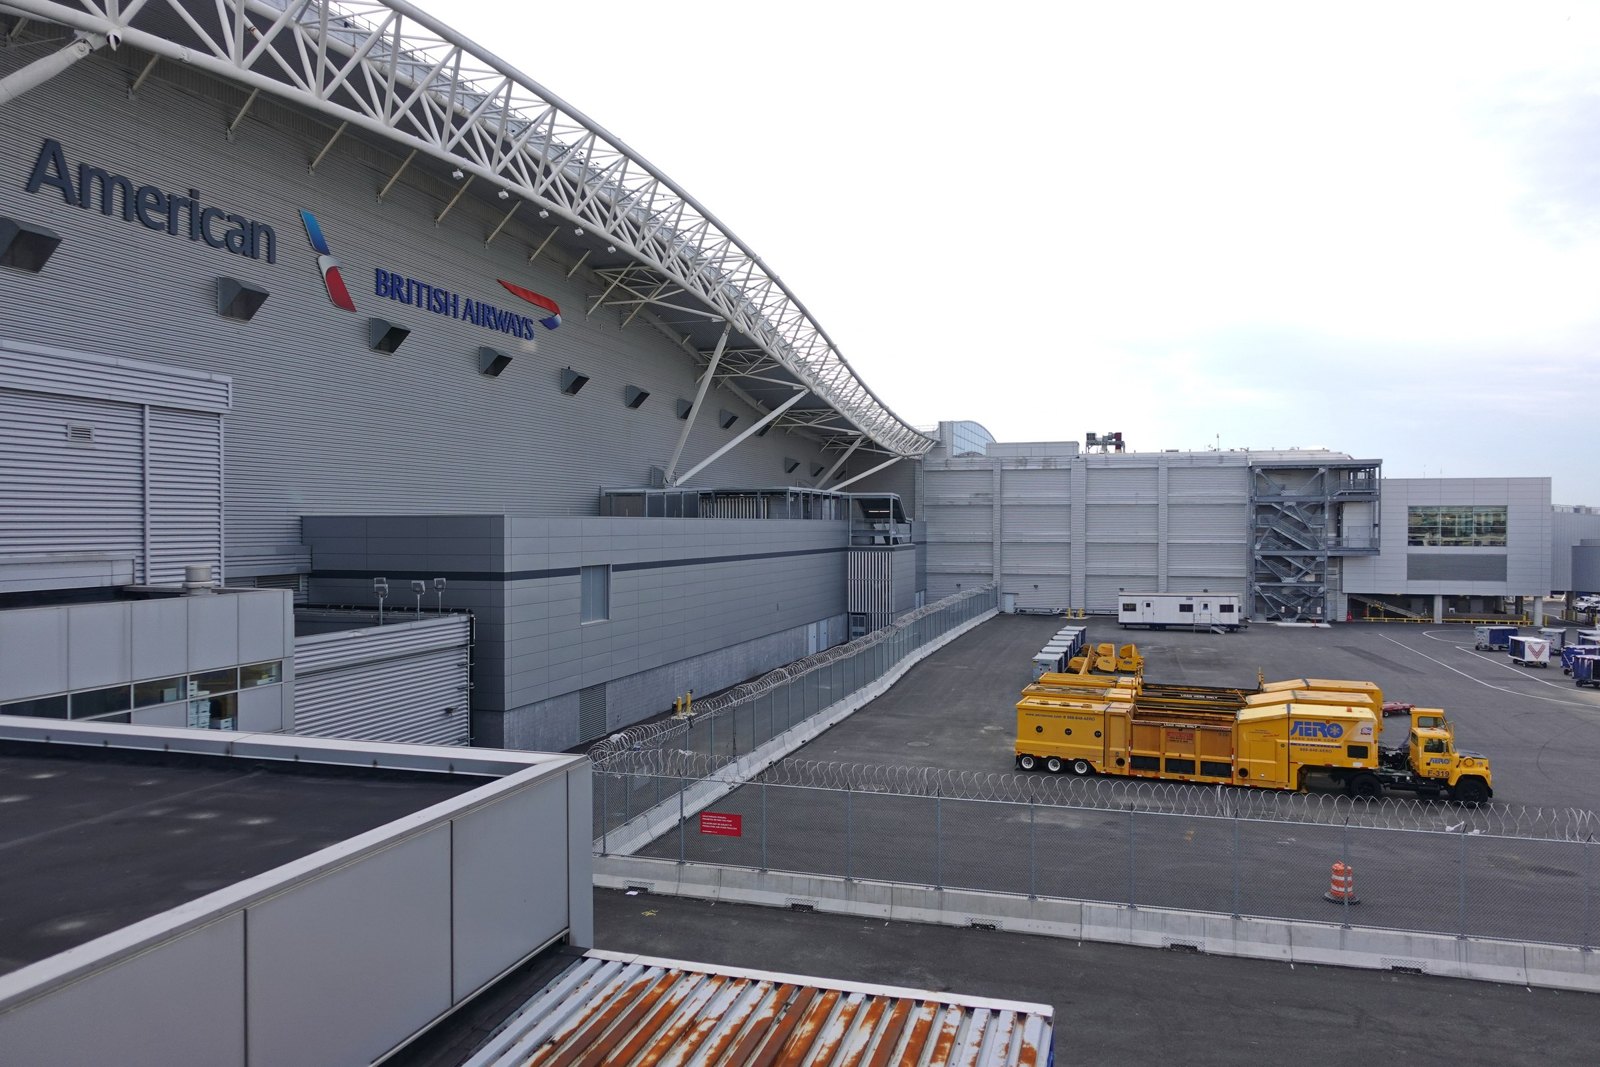
Photo · Terminal 8 exterior, June 2024Wikimedia Commons
Photo: 颐园居, CC BY 4.0 (2024-06-02), via Wikimedia Commons. Illustrative (Tier B), resized only; the photograph is not a measurement.
Fig. 2 · Venue medians across 134 gate points · 5G RSRP and SINRSource · Ookla
RSRP on a −110 to −85 dBm axis (SINR on 0 to 15 dB). Locked ladder: healthy ≥ −95 · at-risk −95 to −110 · critical < −110 dBm. Window 2025-09-01 to 2026-08-31.
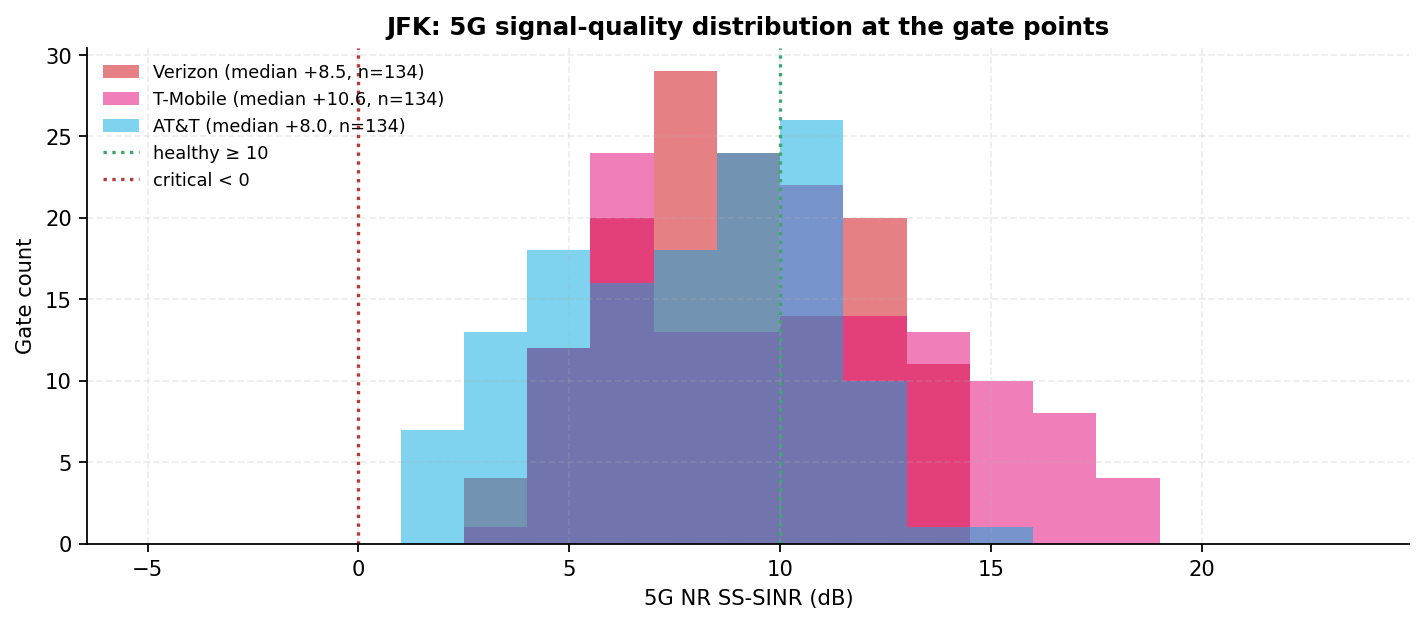
Fig. 3 · SINR distribution per carrier at the gate pointsSource · Ookla
SINR healthy threshold ≥ 10 dB. T-Mobile is the SINR leader at the gate-area median (+10.6 dB, 71 of 134 healthy). Window 2025-09-01 to 2026-08-31.
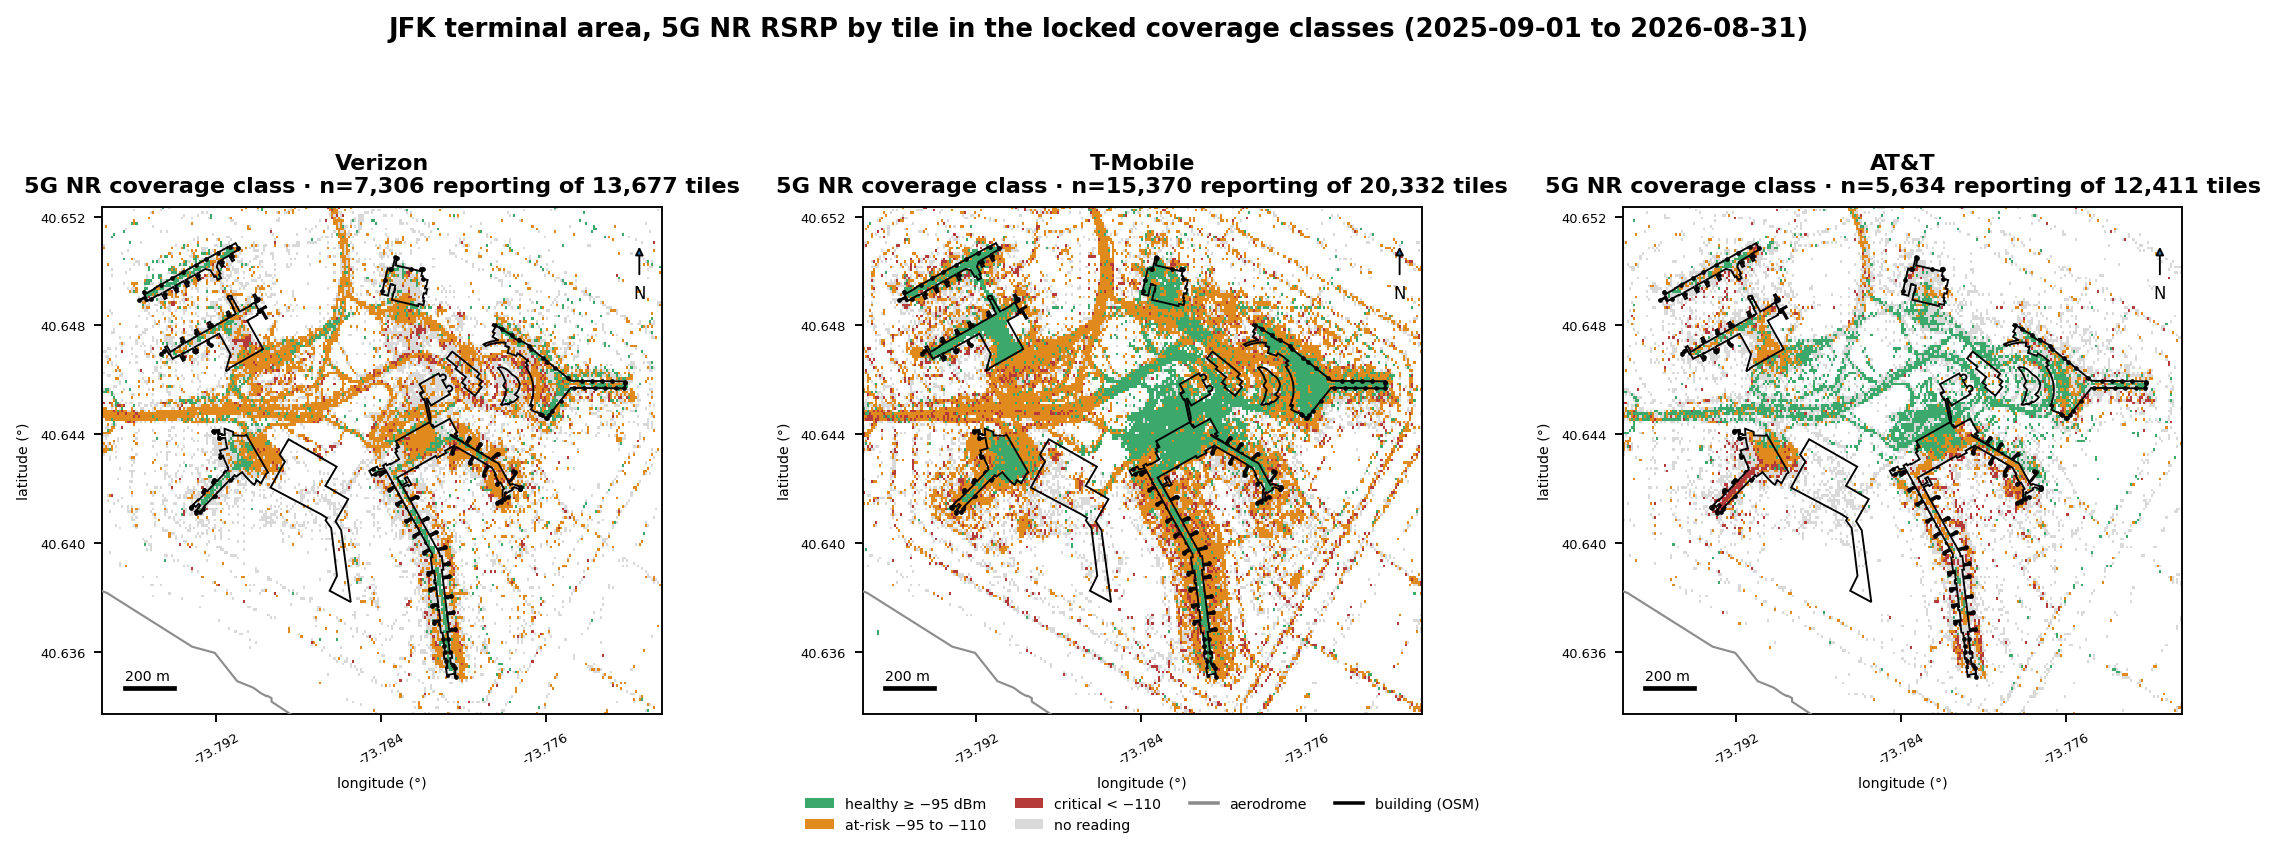
Fig. 4 · 5G NR RSRP by tile · terminal area · locked coverage classSource · Ookla
5G NR RSRP by tile, terminal area, locked coverage class; grey = no 5G reading. Each tile is about 8 m by 11 m; n is the tile count per panel, printed on the figure. Gate labels are off for legibility. Source: Ookla Cell Analytics. Window 2025-09-01 to 2026-08-31.
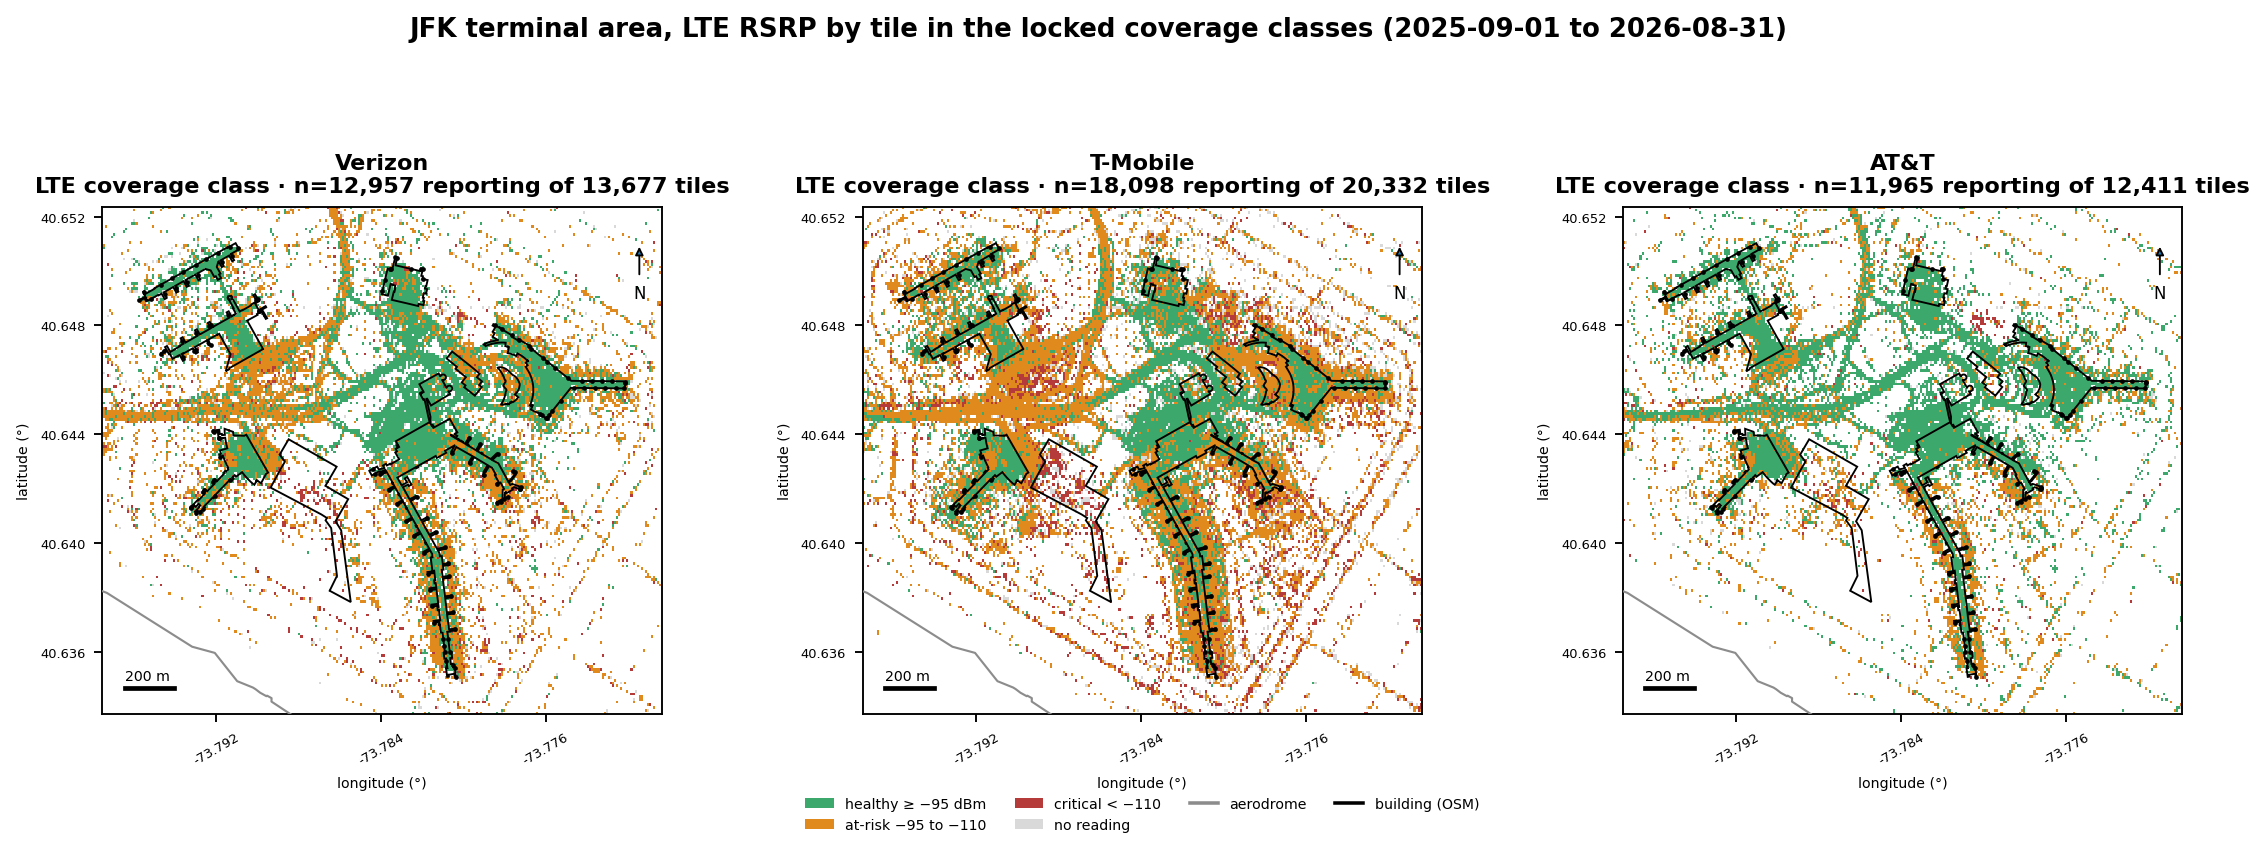
Fig. 5 · LTE RSRP by tile · terminal area · locked coverage classSource · Ookla
LTE RSRP by tile, terminal area, locked coverage class; grey = no LTE reading. Same extent and tile geometry as Fig. 4; gate labels are off for legibility. This is the LTE layer that carries AT&T's traffic where its 5G footprint is thin. Source: Ookla Cell Analytics. Window 2025-09-01 to 2026-08-31.
Section 4
Results by terminal
Building-masked basis · the leader basis
Two bases. Building-masked: tiles whose centroid lies inside the pinned OpenStreetMap terminal polygon;
the healthy share of 5G-reporting tiles inside it decides the terminal leader (n ≥ 30 reporting tiles per carrier;
margins under 5 points are ties; the carrier's 5G footprint share inside the polygon is printed beside it).
Gate-area: the mean of tiles within 80 m of each gate point, which straddles the apron (terminal gate counts T1
16, T4 47, T5 29, T7 10, T8 32; mean interior share T1 24%, T4 22%, T5 33%, T7 41%, T8 30%). Gate-area tallies are
counts with n visible and are never rankings. New Terminal One holds no gates and no tenant points in the window and
appears only as a count-only footprint.
Terminal
Verizon reporting of inside (fp) · healthy · median
T-Mobile reporting of inside (fp) · healthy · median
AT&T reporting of inside (fp) · healthy · median
Leader (margin)
Terminal 1
192 of 306 (fp 63%) · 49% · −96.0 dBm
330 of 338 (fp 98%) · 62% · −91.0 dBm
226 of 321 (fp 70%) · 10% · −109.0 dBm
T-Mobile+13 pts
New Terminal Oneunder construction
23 reporting of 133count only, below n=30
131 of 333 (fp 39%) · 8% · −108.0 dBm
10 reporting of 199count only, below n=30
count only
Terminal 4
558 of 880 (fp 63%) · 36% · −99.0 dBm
885 of 926 (fp 96%) · 69% · −91.0 dBm
530 of 790 (fp 67%) · 39% · −98.0 dBm
T-Mobile+30 pts
Terminal 5
385 of 610 (fp 63%) · 34% · −101.0 dBm
618 of 647 (fp 96%) · 70% · −90.0 dBm
334 of 530 (fp 63%) · 60% · −94.0 dBm
T-Mobile+10 pts
Terminal 7
92 of 198 (fp 46%) · 30% · −98.5 dBm
200 of 214 (fp 93%) · 77% · −89.0 dBm
75 of 191 (fp 39%) · 43% · −97.0 dBm
T-Mobile+34 pts
Terminal 8
311 of 505 (fp 62%) · 40% · −99.0 dBm
521 of 555 (fp 94%) · 82% · −87.0 dBm
311 of 517 (fp 60%) · 35% · −100.0 dBm
T-Mobile+42 pts
Building-masked basis. Per carrier: 5G-reporting tiles inside the polygon (n) of all tiles inside · footprint share (fp) · healthy share of reporting tiles · median 5G RSRP of reporting tiles.
Leader margin in points of healthy share. n counts tiles, not scans.
Leader list (printed once; referenced everywhere else). Decisive: Terminal 1 T-Mobile by 13 points; Terminal 4
T-Mobile by 30 points; Terminal 5 T-Mobile by 10 points; Terminal 7 T-Mobile by 34 points; Terminal 8 T-Mobile by 42
points. Ties: none. Cross-check: the leader on the panel-sensitive present-and-healthy share of all tiles inside the
polygon agrees with the conditional leader in every ranked terminal. Conditional-median leader by terminal: T1
T-Mobile, T4 T-Mobile, T5 T-Mobile, T7 T-Mobile, T8 T-Mobile. Tally of decisive leads: T-Mobile 5.
Fig. 6 · Building-masked healthy share of 5G-reporting tiles per terminal and carrierSource · Ookla
The terminal-leader basis. fp = each carrier's 5G footprint share inside the polygon. Window 2025-09-01 to 2026-08-31.
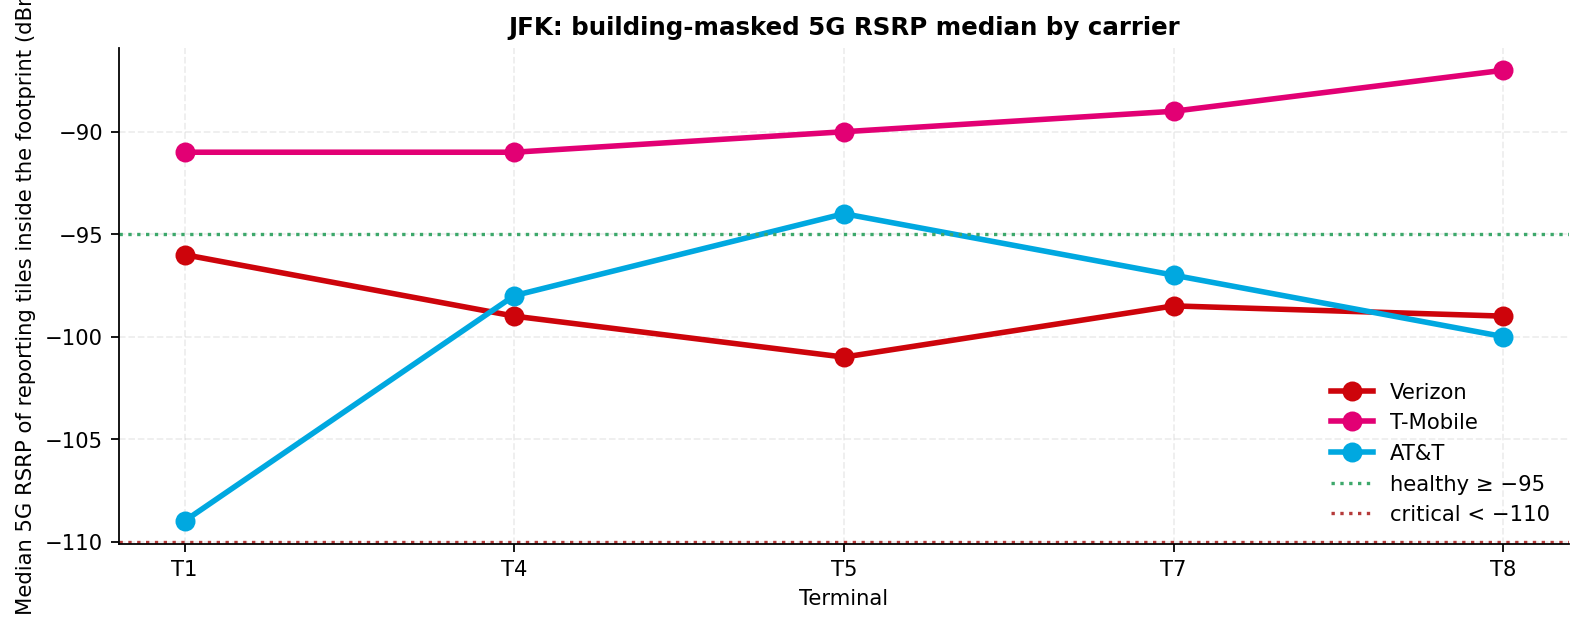
Fig. 7 · Building-masked median 5G RSRP of reporting tiles per terminal and carrierSource · Ookla
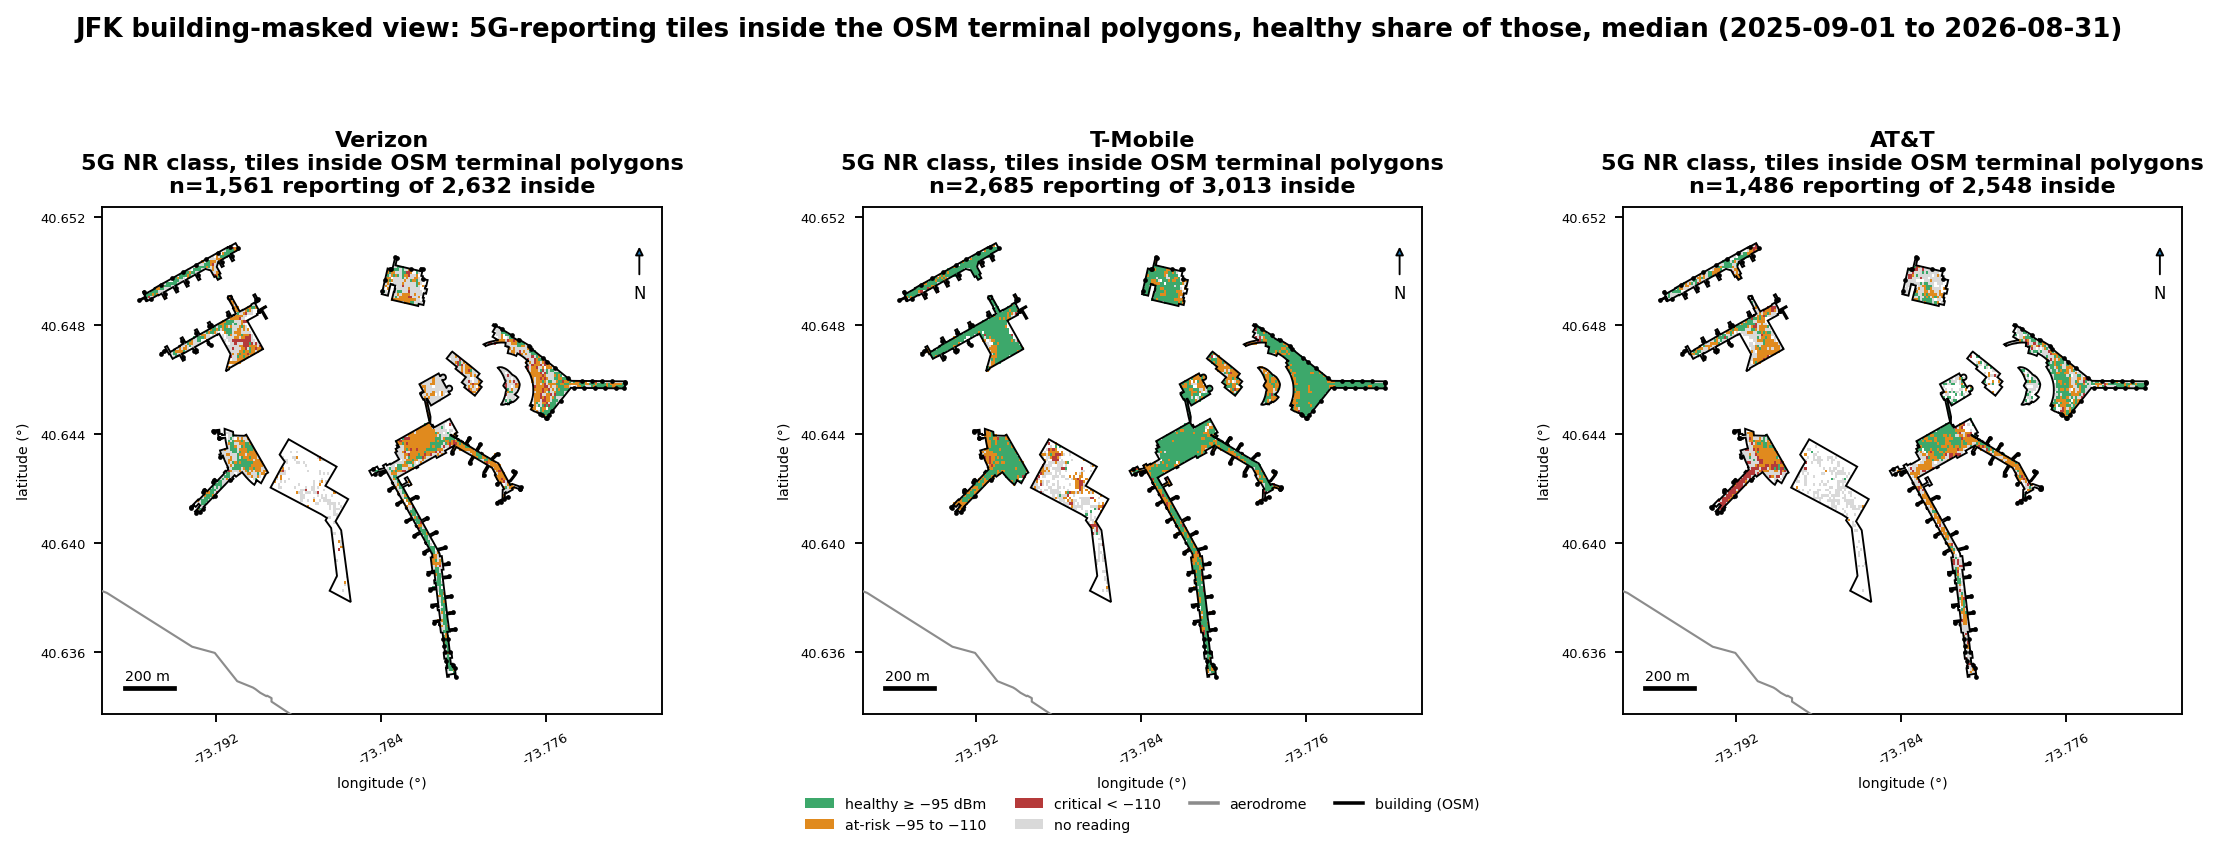
Fig. 8 · Building-masked map · 5G NR class for reporting tiles inside the OSM terminal polygonsSource · Ookla
5G-reporting tiles whose centroid falls inside a pinned OSM terminal polygon (T1, NTO, T4, T5, T7, T8). This is our OSM building-polygon mask, not Ookla's Indoor layer. Source: Ookla Cell Analytics on OpenStreetMap footprints. Window 2025-09-01 to 2026-08-31.
The mask is a point-in-polygon test of tile centroids against the pinned OpenStreetMap footprints, so it selects
tiles over the buildings rather than tiles measured inside them. It is the only lens in this export that reads the
buildings rather than the apron, which is why it decides the terminal leaders and the section 13 criteria.
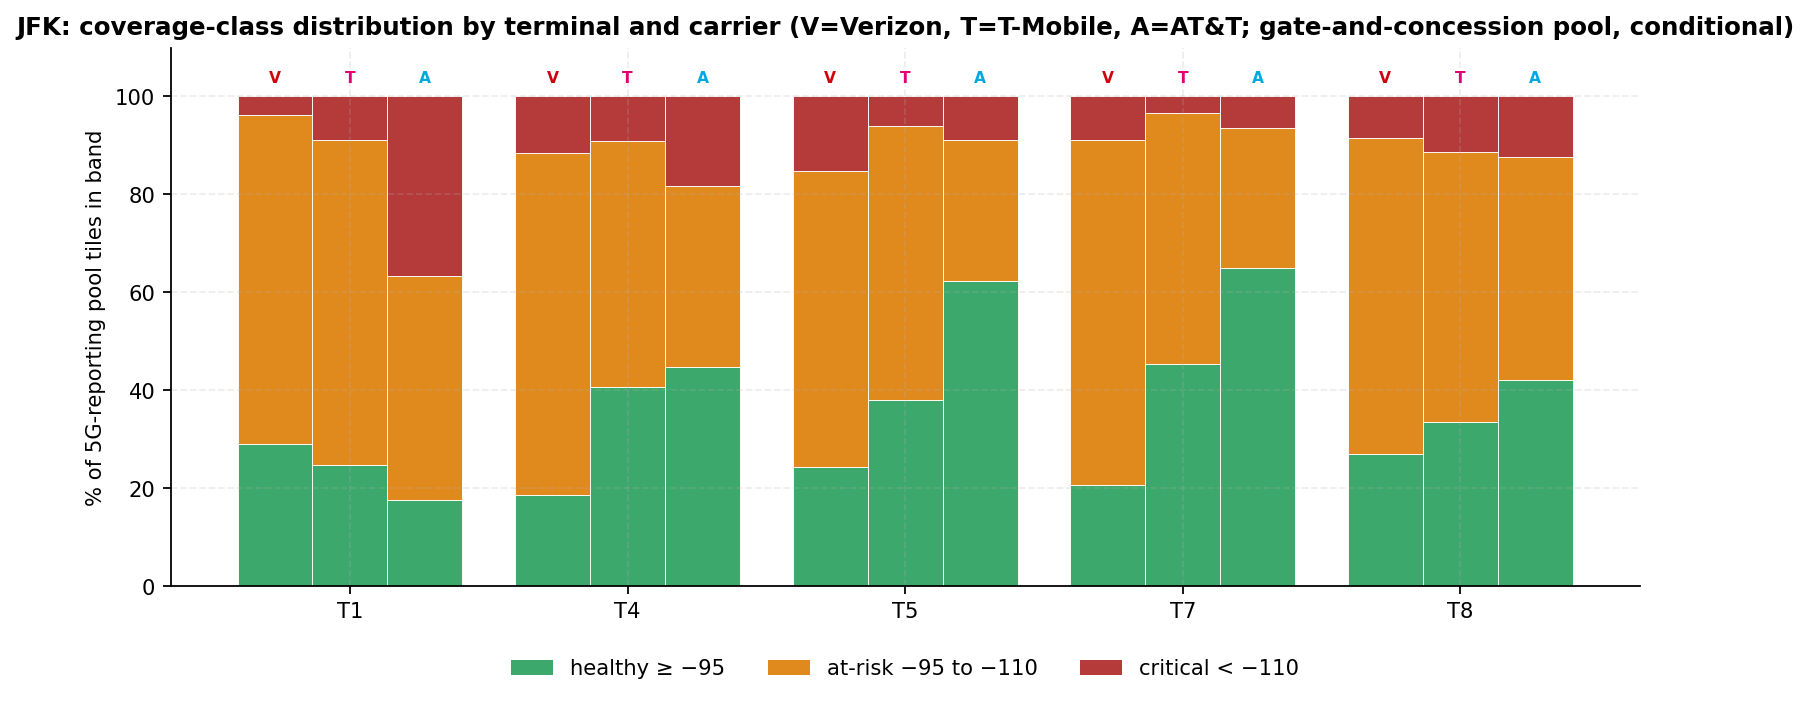
Coverage class on the gate-and-concession pool
Critical-band gate points (below −110 dBm) by carrier: Verizon 0, T-Mobile 0, AT&T 12 of 134 (counts). On the
pool basis (nearest gate or tenant point within 80 m; never the leader basis), the critical share peaks for Verizon in
Terminal 5 at 15% of reporting tiles (n=1,057); T-Mobile in Terminal 8 at 11% of reporting tiles (n=2,039); AT&T in
Terminal 1 at 37% of reporting tiles (n=457).
Fig. 9 · Coverage-class distribution by terminal and carrier · 80 m gate-and-concession poolSource · Ookla
V = Verizon, T = T-Mobile, A = AT&T. Conditional on a reading; not the leader basis. Window 2025-09-01 to 2026-08-31.
How to read a tile map
Each tile is 0.0001° by 0.0001°, about 8 m by 11 m at 40.6° N, and is colored by the locked ladder from the tile's
aggregated RSRP over the window. A tile with no reading had no 5G sample from the Android panel in the window. That
means no measurement, not no coverage, and the share of such tiles is panel-sensitive.
Section 5
Cross-carrier concordance
Gate-area counts · interior re-cut · apron caveat
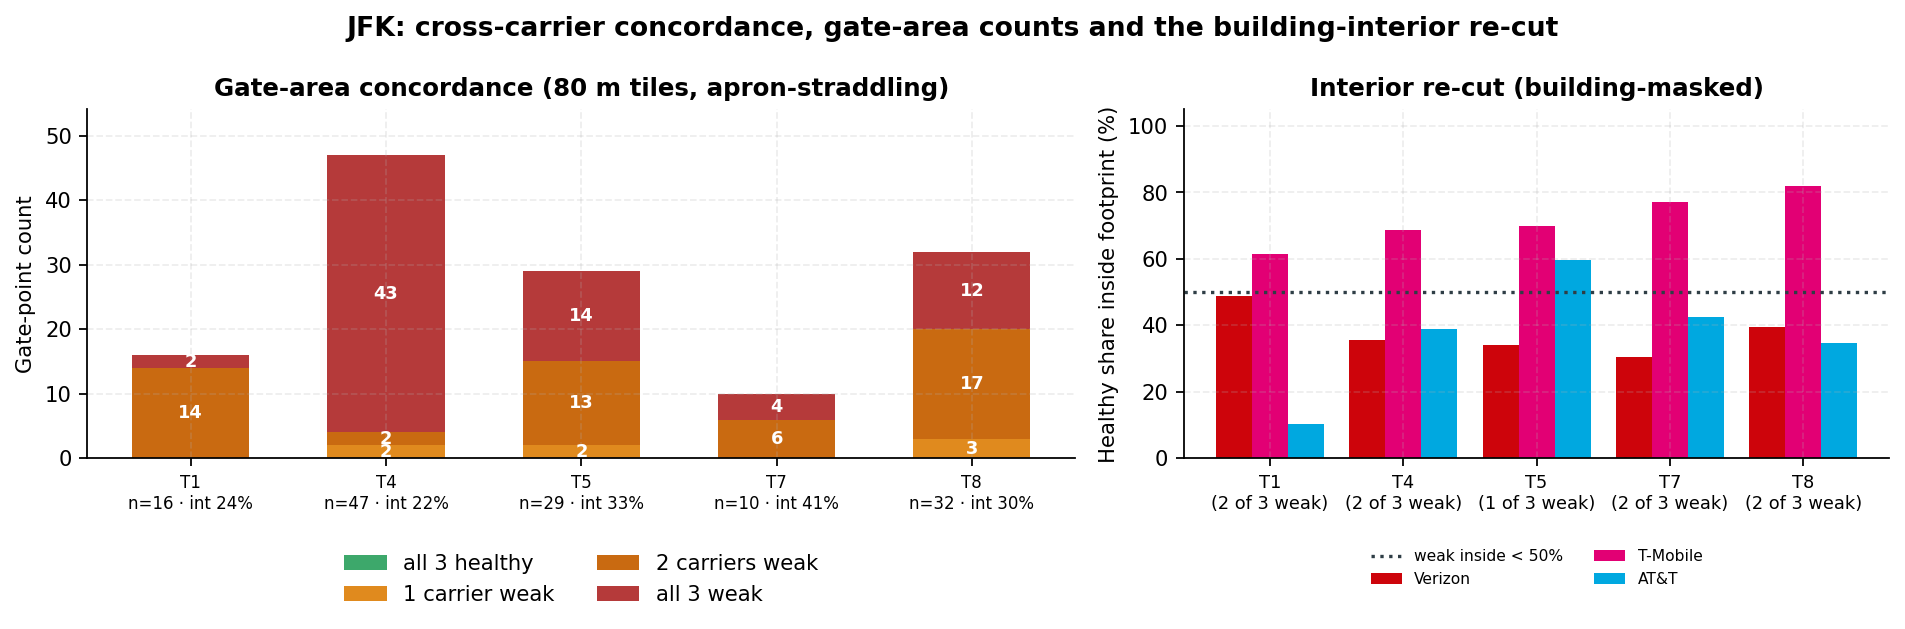
Apron caveat first. Each gate point's value is the mean of tiles within 80 m; the share of those tiles whose
centroid lies inside a terminal polygon (the interior share) averages T1 24% (median 28%), T4 22% (median 23%), T5 33%
(median 30%), T7 41% (median 42%), T8 30% (median 31%). 7 of 134 gate points have an interior share at or above 50%
(T1 0, T4 0, T5 4, T7 2, T8 1). Gate-area readings therefore describe the pier edge and the stand more than the
concourse.
0
Gate points healthy for all three carriers · of 134 · gate-area basis
7
Gate points weak for exactly one carrier · Verizon at 4 · AT&T at 3
52
Gate points weak for two carriers
75
Gate points weak for all three carriers · of 134
By terminal, all-weak gate points: T1 2 of 16, T4 43 of 47, T5 14 of 29, T7 4 of 10, T8 12 of 32.
Interior re-cut (building-masked; a carrier is weak inside a footprint when its healthy share of
5G-reporting tiles is below 50%): Terminal 1 2 of 3 weak (Verizon, AT&T); Terminal 4 2 of 3 weak (Verizon,
AT&T); Terminal 5 1 of 3 weak (Verizon); Terminal 7 2 of 3 weak (Verizon, AT&T); Terminal 8 2 of 3 weak
(Verizon, AT&T). No footprint is weak for all three carriers on the interior re-cut, while 75 of 134 gate points
are weak for all three on the gate-area basis. Read together: the apron-straddling tile sets are weak for
everyone, and inside the buildings the weakness is carrier-specific.
Fig. 10 · Carriers below the healthy line per gate point, and the building-interior re-cutSource · Ookla
Left: gate-area counts (mean interior share on the axis). Right: building-masked healthy share of 5G-reporting tiles inside each footprint per carrier against the interior weak line. Window 2025-09-01 to 2026-08-31.
Sensitivity of the gate-area headline to the healthy line
Healthy line
Verizon gate points below
T-Mobile gate points below
AT&T gate points below
Below for all three
−95 dBm
110 of 134
101 of 134
125 of 134
75 of 134
−100 dBm
40 of 134
57 of 134
69 of 134
20 of 134
−105 dBm
1 of 134
1 of 134
39 of 134
0 of 134
Gate-area basis. The locked −95 dBm line is the Imagine Wireless Venue Network Intelligence ladder; no client-specified design target was provided, and the building-masked basis in section 4 uses the locked line.
Section 6
Terminal 4 and Terminals 5 and 8
47 T4 · 29 T5 · 32 T8 gate points
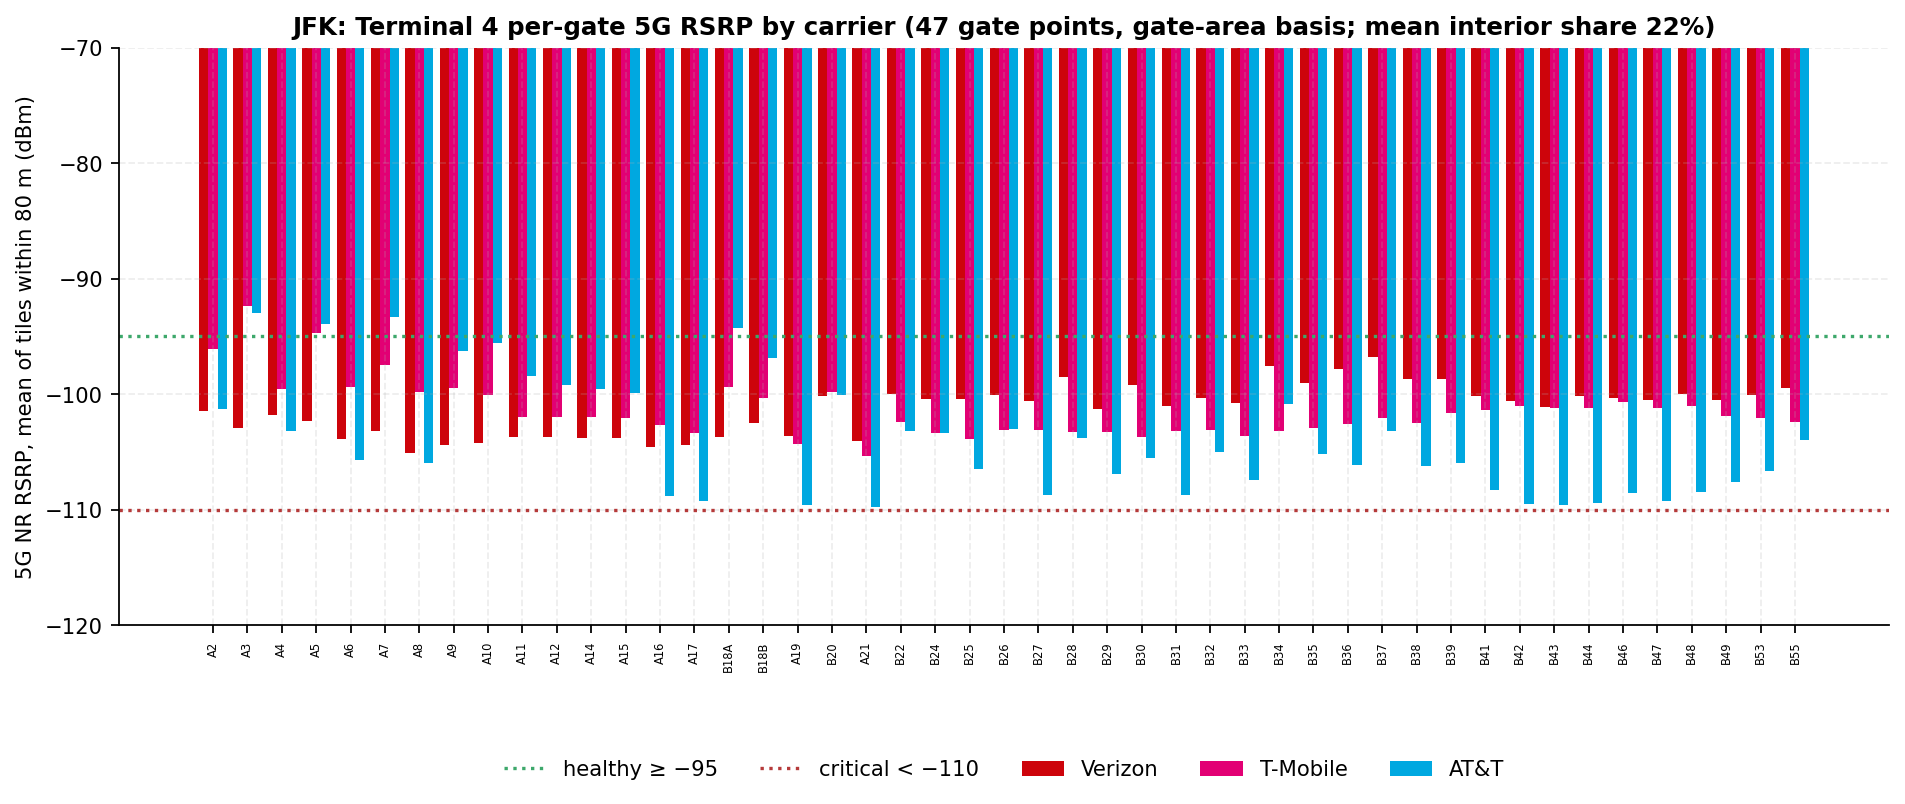
Terminal 4
Terminal 4 hosts Delta plus international carriers (Emirates, Virgin Atlantic, Etihad, KLM, Singapore, LATAM);
operated by JFKIAT (Tier B) and holds 47 of the 134 gate points. Building-masked: T-Mobile leads by 30 points;
healthy shares of reporting tiles Verizon 36% (n=558, footprint 63%), T-Mobile 69% (n=885, footprint 96%), AT&T
39% (n=530, footprint 67%); interior re-cut 2 of 3 carriers weak (Verizon, AT&T). Gate-area (counts; mean
interior share 22%): medians Verizon −100.6 dBm (0 of 47 healthy), T-Mobile −102.0 dBm (2 of 47 healthy), AT&T
−105.5 dBm (4 of 47 healthy); best-5G Verizon 24, AT&T 9, T-Mobile 6, 8 tied under the floor; all-weak 43 of 47.
OpenStreetMap inventory after same-ref merge. Each bar is a mean over at least 30 tiles within 80 m of the gate point. Window 2025-09-01 to 2026-08-31.
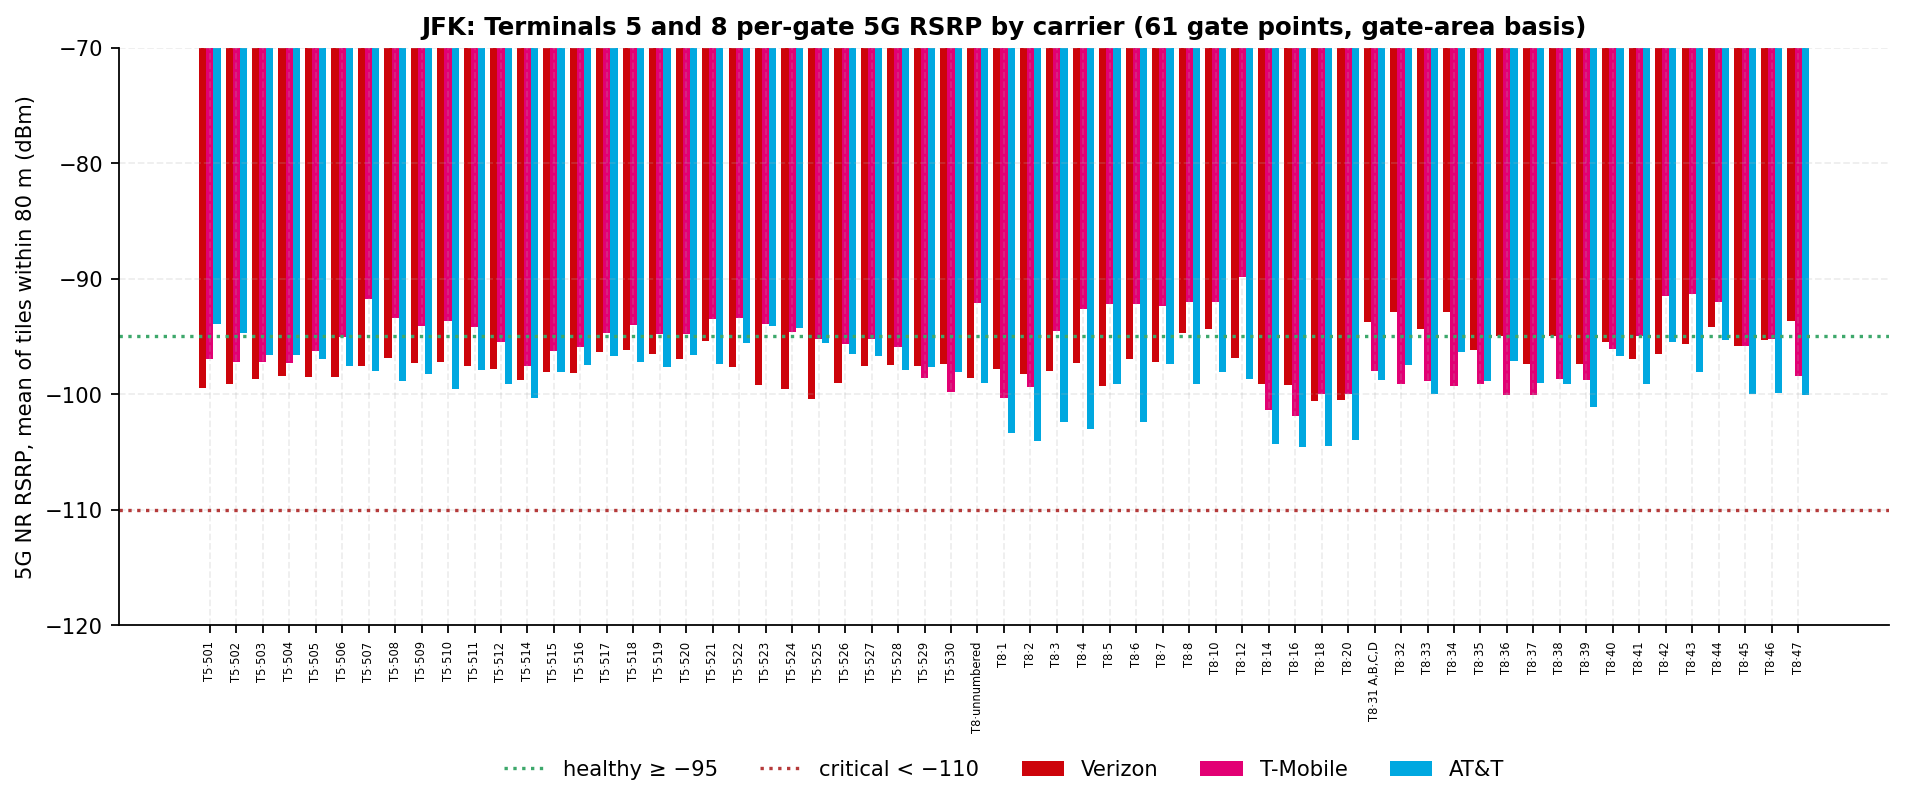
Terminal 8
Terminal 8 hosts American plus oneworld partners (British Airways, Finnair, Iberia, Japan Airlines, Qatar, Cathay
Pacific) and Alaska Airlines (Tier B; Alaska Airlines moved from Terminal 7 to Terminal 8 in October 2025, cited, not
held) and holds 32 gate points. Building-masked: T-Mobile by 42 points; healthy shares Verizon 40% (n=311,
footprint 62%), T-Mobile 82% (n=521, footprint 94%), AT&T 35% (n=311, footprint 60%); interior re-cut 2 of 3 weak.
Gate-area (counts; mean interior share 30%): medians Verizon −96.7 (10 of 32 healthy), T-Mobile −97.0 (13 of 32
healthy), AT&T −99.1 (0 of 32 healthy) dBm; best-5G Verizon 14, T-Mobile 13, 5 tied under the floor.
Terminal 5
Terminal 5 hosts JetBlue domestic and daytime international arrivals (Tier B) and holds 29 gate points.
Building-masked: T-Mobile by 10 points; healthy shares Verizon 34% (n=385, footprint 63%), T-Mobile 70% (n=618,
footprint 96%), AT&T 60% (n=334, footprint 63%); interior re-cut 1 of 3 weak. Gate-area (counts; mean interior
share 33%): medians Verizon −97.7 (0 of 29 healthy), T-Mobile −95.2 (13 of 29 healthy), AT&T −97.4 (4 of 29
healthy) dBm; best-5G T-Mobile 18, AT&T 2, 9 tied under the floor.
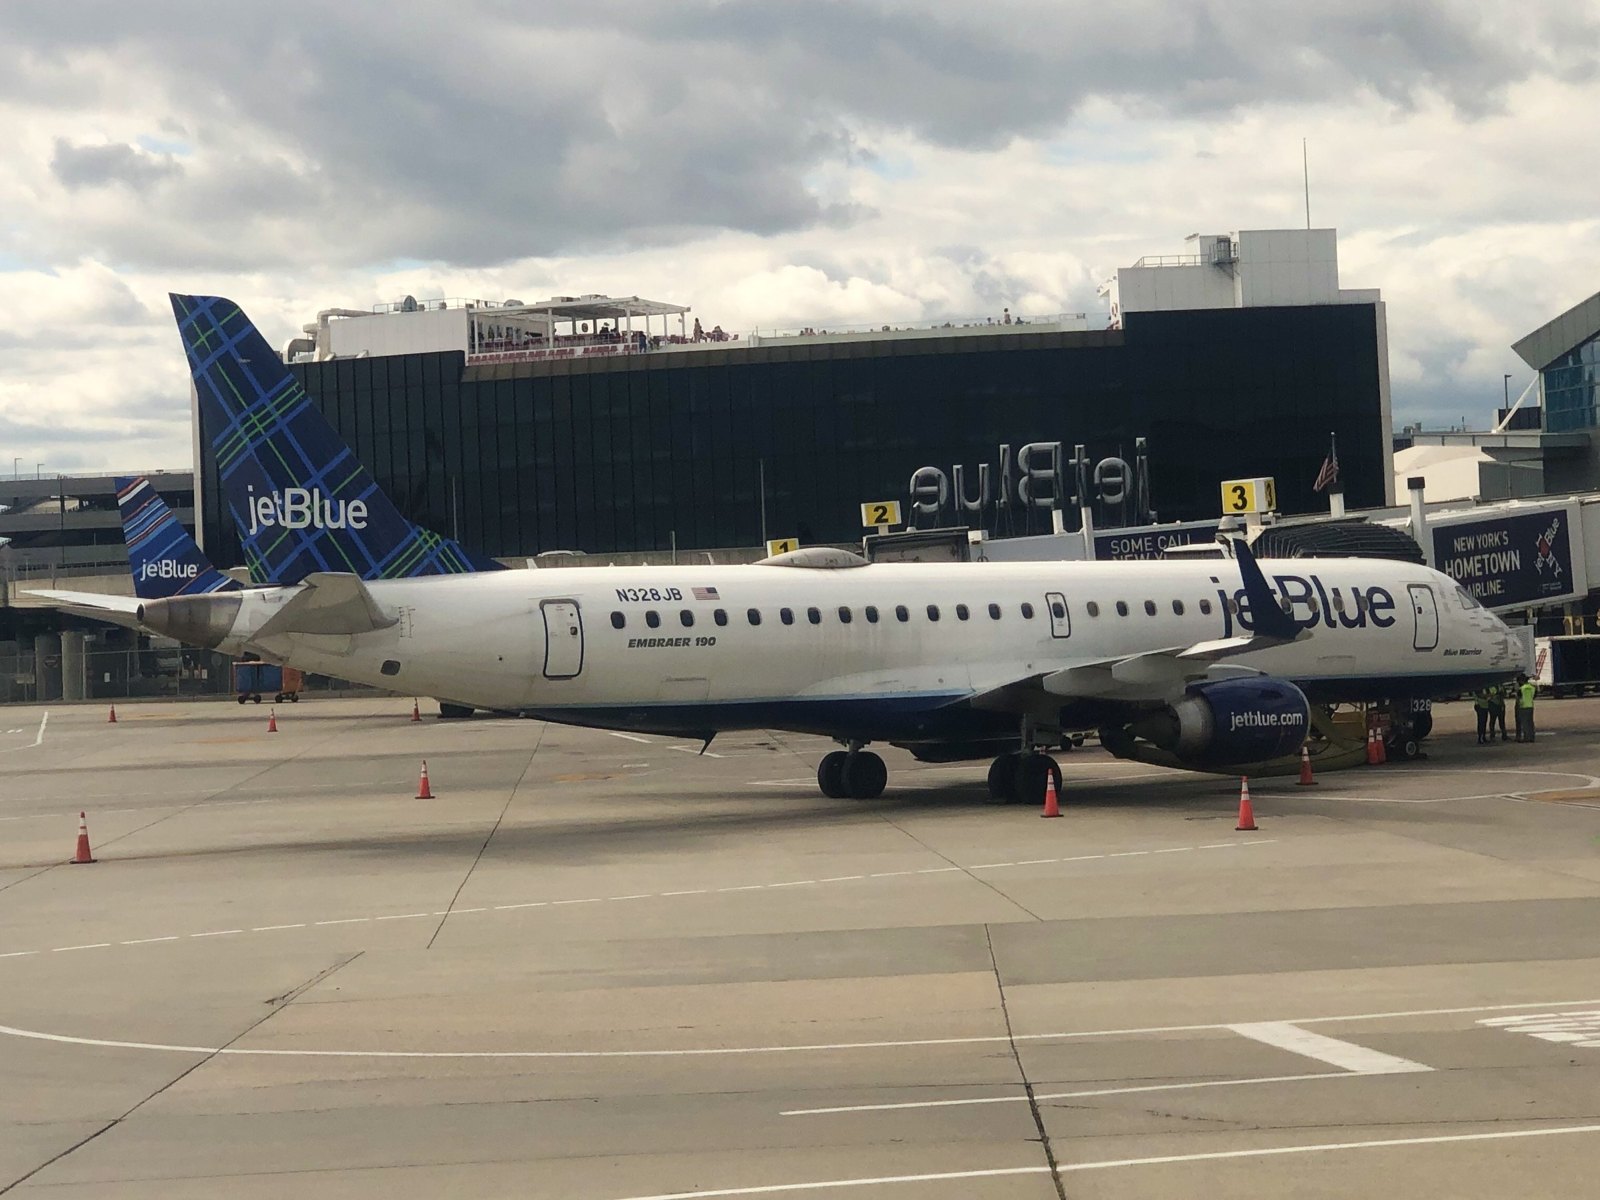
Photo: 颐园居, CC BY-SA 4.0 (2024-06-02), via Wikimedia Commons. Illustrative (Tier B), resized only; the photograph is not a measurement.
Section 7
Terminals 1 and 7 and the construction program
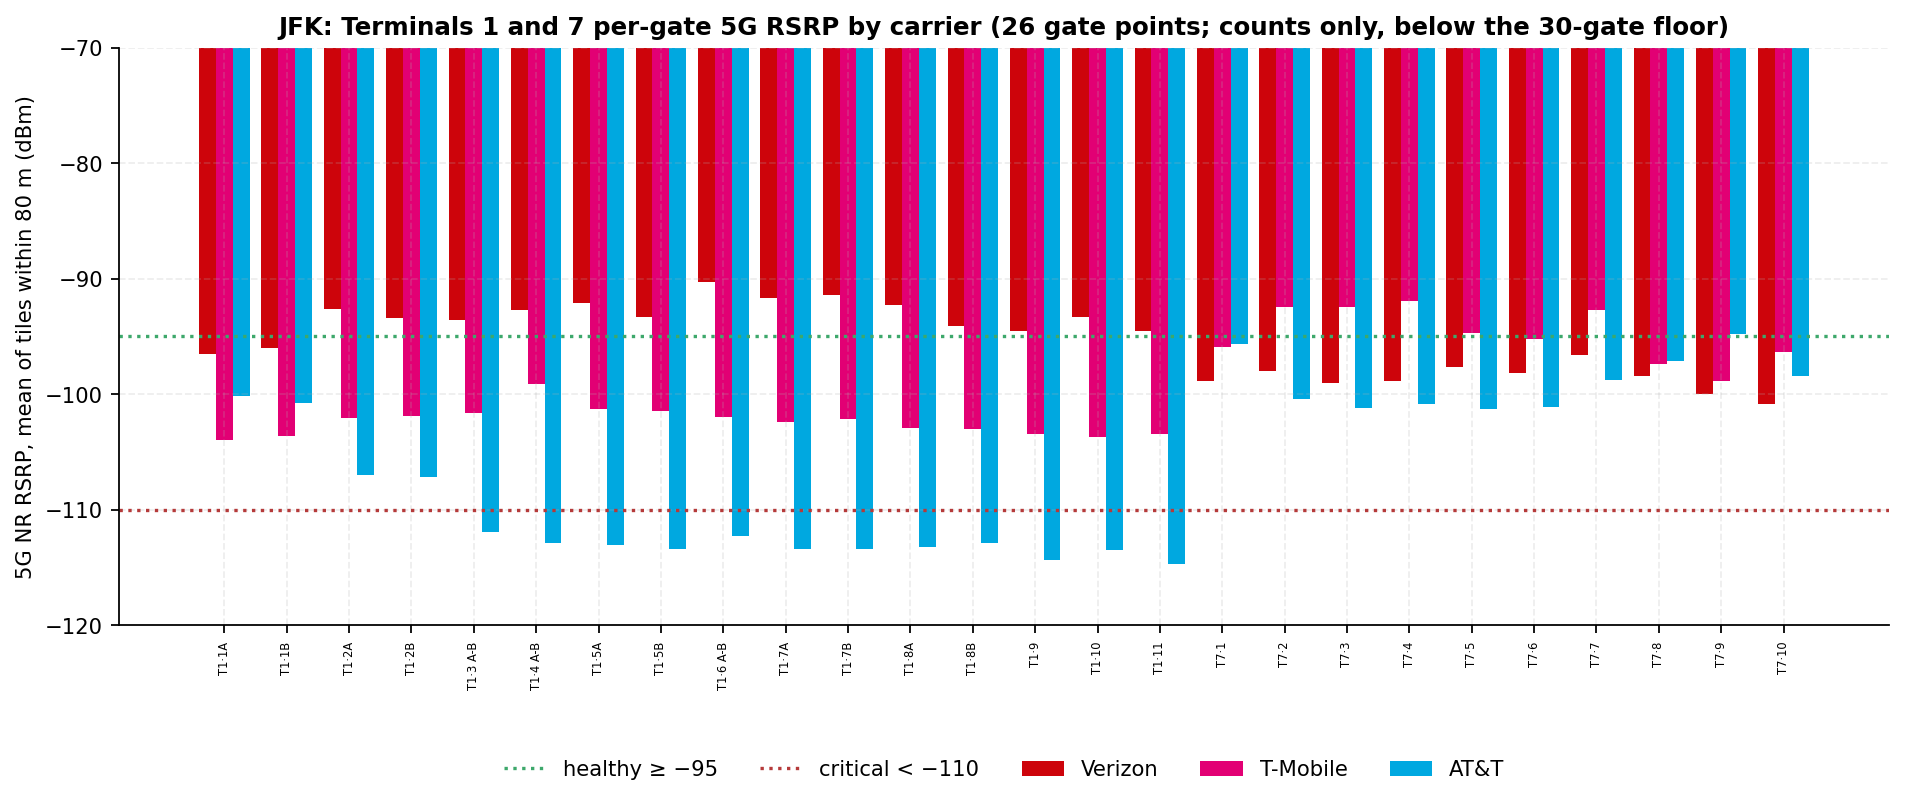
16 T1 · 10 T7 gate points · counts only
Terminal 1
Terminal 1 hosts legacy Terminal 1 international carriers (moving to New Terminal One or Terminal 6 after the
window) (Tier B) and holds 16 gate points. Building-masked: T-Mobile by 13 points; healthy shares Verizon 49%
(n=192, footprint 63%), T-Mobile 62% (n=330, footprint 98%), AT&T 10% (n=226, footprint 70%); interior re-cut 2
of 3 weak. Gate-area (counts, below the floor; mean interior share 24%): best-5G Verizon 16; healthy Verizon 14 of 16,
T-Mobile 0 of 16, AT&T 0 of 16; all-weak 2 of 16. Verizon is best-5G at 16 of 16 Terminal 1 gate points and
healthy at 14 of 16 on the gate-area basis (counts, below the 30-gate floor; mean interior share 24%); the gate points
sit on the piers and the footprint covers the headhouse, so the two bases describe different parts of the building.
Photo · New Terminal One under construction, August 2025Wikimedia Commons
Photo: Charles from Port Chester, New York, CC0 (2025-08-02), via Wikimedia Commons. Illustrative (Tier B), resized only; the photograph is not a measurement.
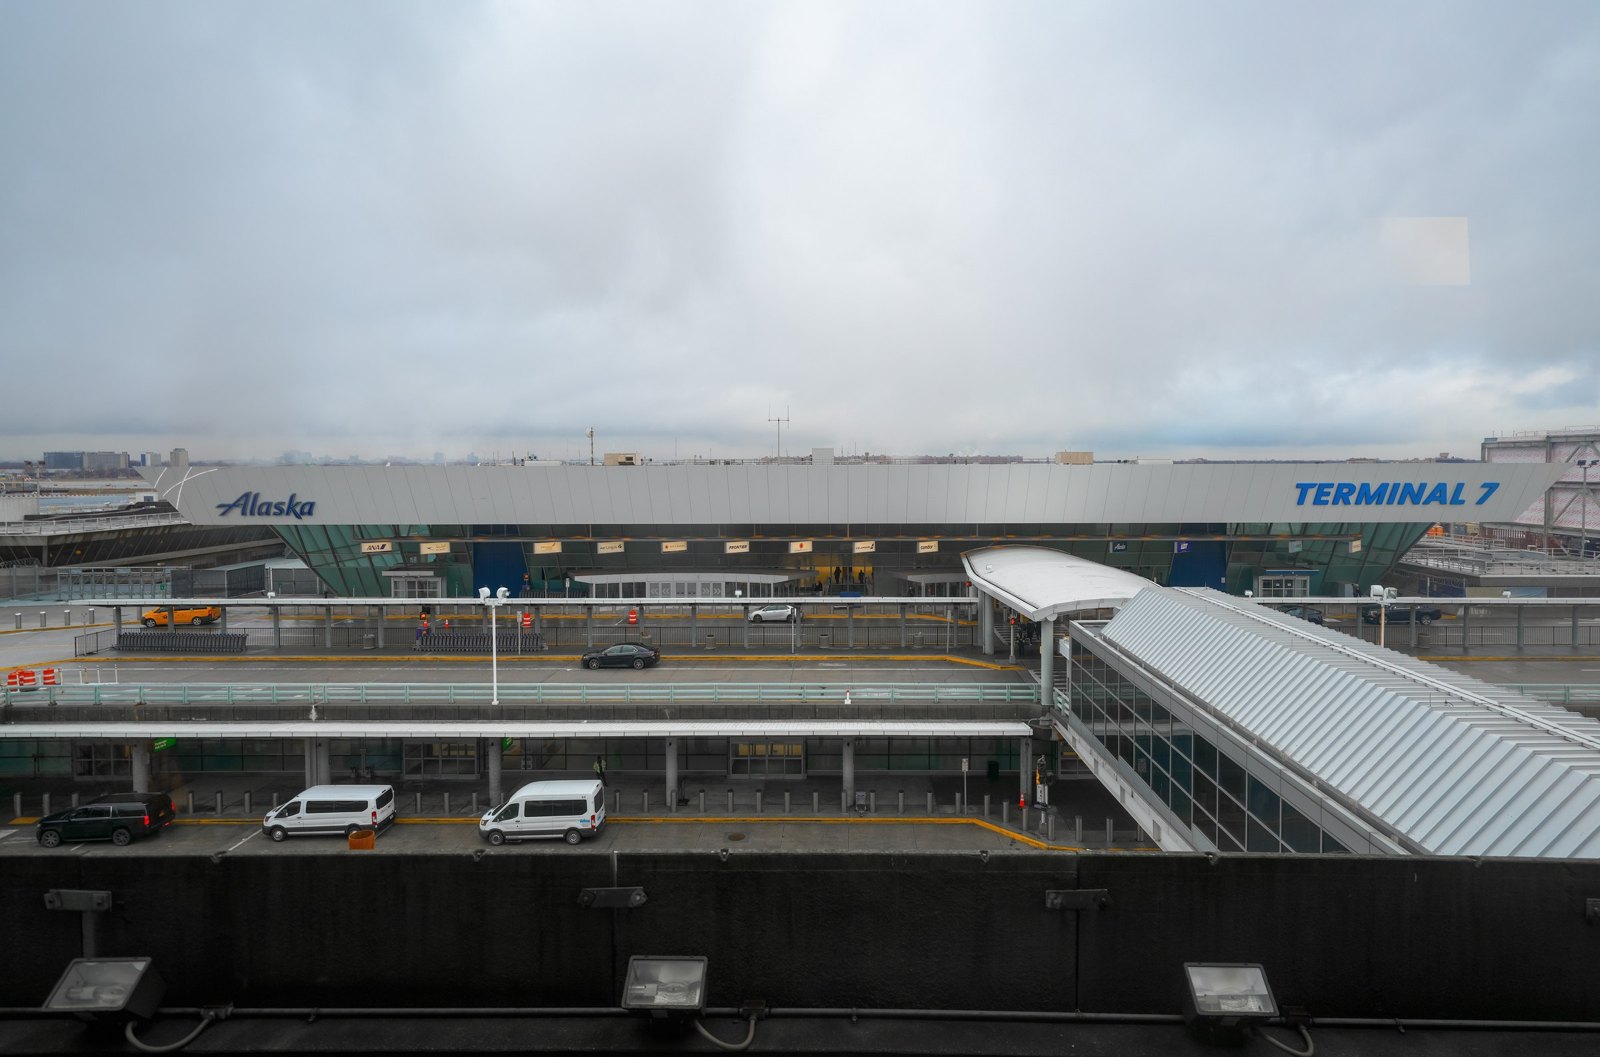
Photo · Terminal 7 departures entrance, February 2025Wikimedia Commons
Photo: Quintin Soloviev, CC BY 4.0 (2025-02-06), via Wikimedia Commons. Illustrative (Tier B), resized only; the photograph is not a measurement.
Terminal 7
Terminal 7 hosts carriers transitioning to Terminal 6 from late 2026; Alaska left for T8 in October 2025 (Tier B)
and holds 10 gate points. Building-masked: T-Mobile by 34 points; healthy shares Verizon 30% (n=92, footprint
46%), T-Mobile 77% (n=200, footprint 93%), AT&T 43% (n=75, footprint 39%); interior re-cut 2 of 3 weak. Gate-area
(counts, below the floor; mean interior share 41%): best-5G T-Mobile 7, AT&T 1, 2 tied under the floor; healthy Verizon 0 of 10, T-Mobile 5
of 10, AT&T 1 of 10; all-weak 4 of 10.
Gate-area basis; OpenStreetMap inventory; counts only, below the 30-gate floor. Window 2025-09-01 to 2026-08-31.
The construction program
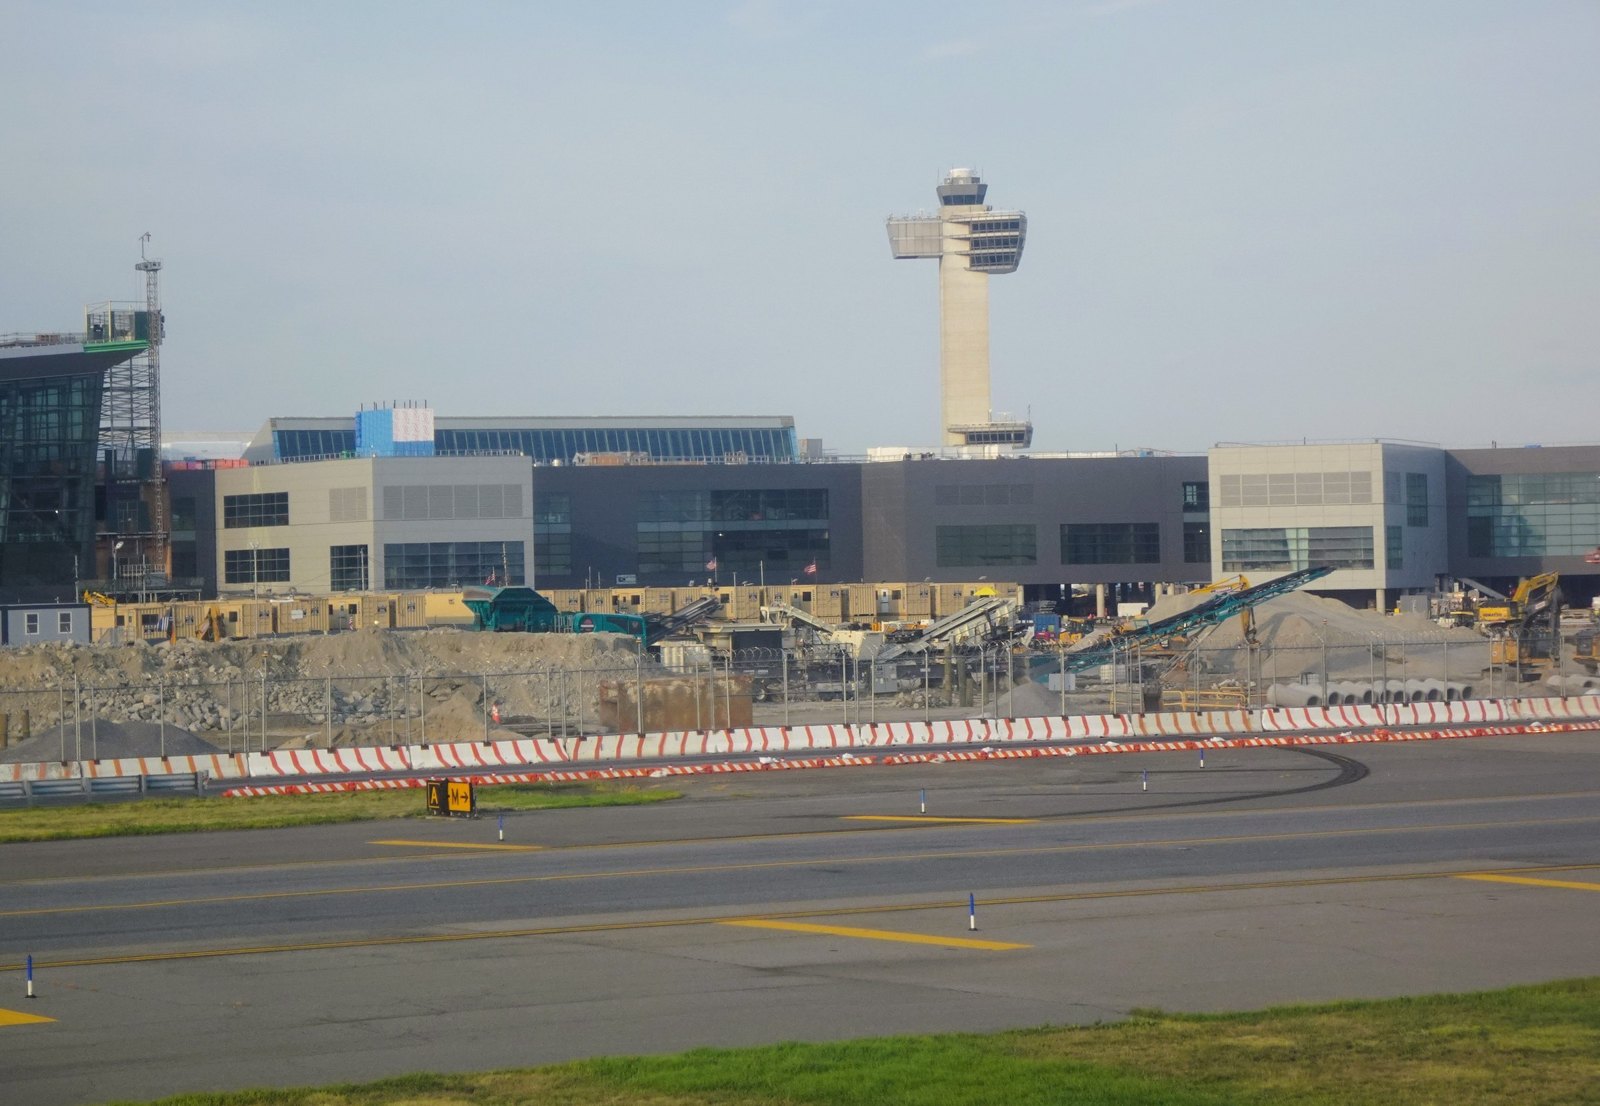
Both terminals are on the program's replacement list. New Terminal One (NTO; $9.5 billion, 23 gates) rises on the
Terminal 1 site and the former Terminals 2 and 3 site and is not open in the measurement window; the first phase is
now expected in early 2027. Terminal 6 ($4.2 billion, 10 gates) has its first gates expected in late 2026, replacing
the former Terminal 6 and eventually Terminal 7. Terminal 2 has been demolished and has no footprint in OpenStreetMap.
All cited source. In-building investment in Terminal 1 and Terminal 7 should therefore
be scoped to their remaining service life, and the new buildings are where the section 13 criteria should be written
into the design.
Section 8
Terminal vs periphery proxy
Category proxy · tile basis
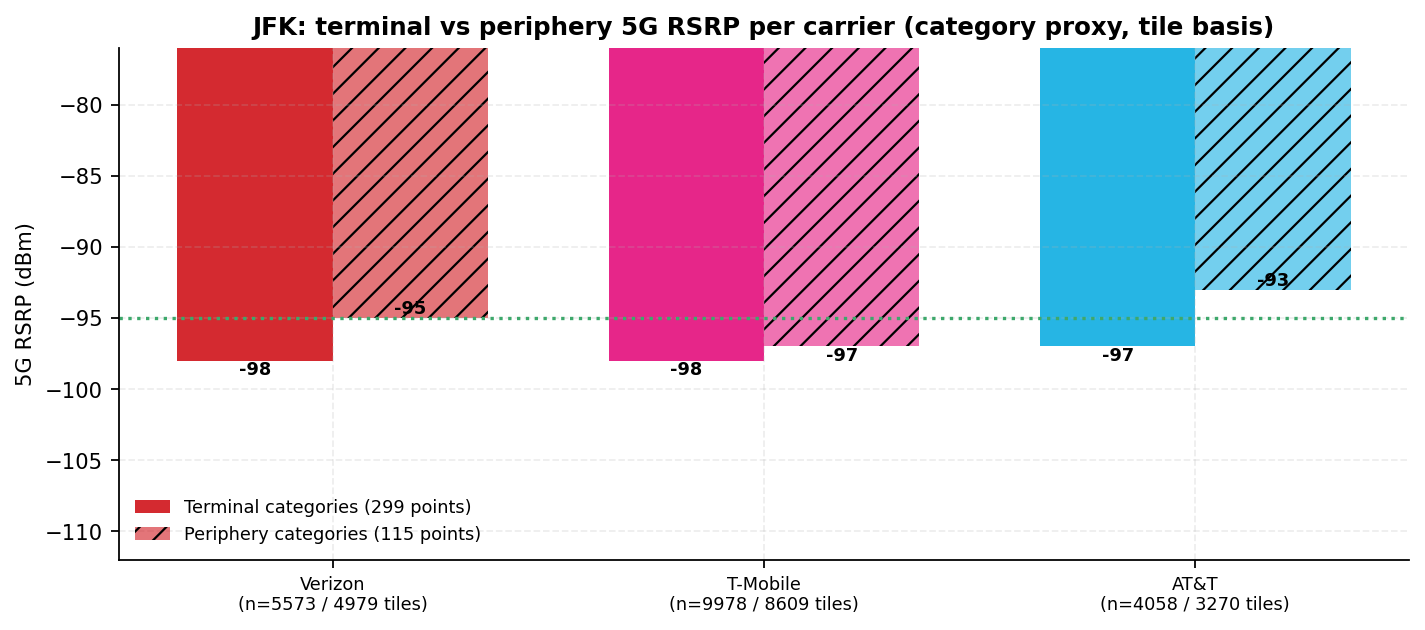
This proxy compares each carrier's median 5G RSRP over tiles near terminal-category points (retail, food, lounge,
admin, services; 299 points) with tiles near periphery-category points (transport admin, lodging, other; 115 points).
Terminal categories cover the concessions and services inside the terminal footprints; periphery categories cover the
parking lots, the AirTrain stations, the hotel, the cargo area, and roadside businesses. A positive periphery-minus-
terminal delta is consistent with macro spillover; a negative delta is consistent with an in-building or close-in
source; a flat delta is ambiguous.
Distance to macro sites confounds all three, and the Site Finder layer is queued to resolve it. The
building-masked medians in section 4 and the reconciled reading in section 9 are the sharper in-building evidence.
Fig. 14 · Median 5G RSRP · terminal vs periphery tenant categoriesSource · Ookla
Proxy: category-based masking on 414 mapped points (Google Places + OpenStreetMap, pinned 2026-09-15); the building-masked view (section 4) is the sharper in-building lens.
Window 2025-09-01 to 2026-08-31.
Section 9
Neutral-host record and attestation asks
Provider of record · per-terminal map open
Boingo Wireless is the Port Authority's neutral-host DAS and Wi-Fi provider at JFK (Boingo press release, October 14, 2025, held; PANYNJ board authorization, June 26, 2025, Imagine knowledge graph; Airport DAS Master, July 2026, Imagine knowledge graph).Tier B · held
The agreement was authorized on June 26, 2025 under the 2024 RFP, announced on October 14, 2025 as a long-term
agreement to deliver next-generation cellular and free public Wi-Fi across Port Authority properties including JFK,
runs 2026 to 2038, and replaces the 1999 New York Telecom Partners agreement under which Boingo already operated at
JFK; Boingo also provides Passpoint Wi-Fi at JFK. Boingo Wireless, through its subsidiary New York Telecom Partners,
has provided neutral-host distributed antenna system (DAS) and Wi-Fi services at JFK, LaGuardia, and Newark since the
1999 agreement (Boingo press release, August 11, 2014).
The sources we hold do not map which terminal buildings ride on Boingo's network versus terminal-operator systems, nor which carriers are on the DAS in each building; ask Boingo for that map.
On the Boingo-served venue, the tiles show that the building-masked readings favor T-Mobile inside every
ranked footprint and Verizon at the Terminal 1 gate points, both consistent with a close-in or in-building source (an
inference about the radio source; the report does not assign carriers to systems), while the apron-straddling
gate-area medians sit below the healthy line for every carrier.
The in-building signature
The building-masked readings are the strongest in-building evidence in this export. T-Mobile's median inside each
footprint sits +11 dB (T1), +11 dB (T4), +5 dB (T5), +6 dB (T7), +10 dB (T8) from its own gate-area median in
the same terminal, and it holds the highest healthy share inside every ranked footprint (T1 62%, T4 69%, T5 70%, T7
77%, T8 82%). At the Terminal 1 gate points Verizon reads 4 to 22 dB ahead of AT&T with SINR +8.5 to +13.4 dB.
Both patterns are consistent with a close-in or in-building source serving those carriers; this is an inference about
the radio source, and the report does not assign carriers to systems. What the export does not show is any carrier lifting the gate-area 5G
median above the healthy line at most gate points, which is a statement about the apron-straddling 80 m tile sets,
not about the concourses.
Attestation scope
Tile aggregates measure signal, not infrastructure. Macro-site geometry (Ookla Site Finder centroids) is queued for
the next revision, so the section 3 and section 8 readings on macro coverage rest on the RF tiles alone. The
resolution is documentary: Boingo's per-terminal coverage map with the phases and go-live dates of the 2025
agreement, and confirmation from Boingo and the carriers of which carriers are live on the DAS in each building.
See recommendations 1 and 2.
Private wireless
No Citizens Broadband Radio Service (CBRS) or public-safety private-network deployment is recorded for JFK in the
sources this report holds, and the public Ookla layer does not characterize private networks. The two JFK-specific
questions are whether a CBRS layer is scoped alongside the neutral-host upgrade for the New Terminal One and Terminal 6
construction phases, and whether the federal inspection and baggage workflows in Terminals 4 and 8 ride on the public
carriers or on a dedicated layer; both are design questions for the Port Authority and the terminal operators, not
measurements.
Section 10
Spectrum and 5G footprint
Footprint · low-band attachment · availability
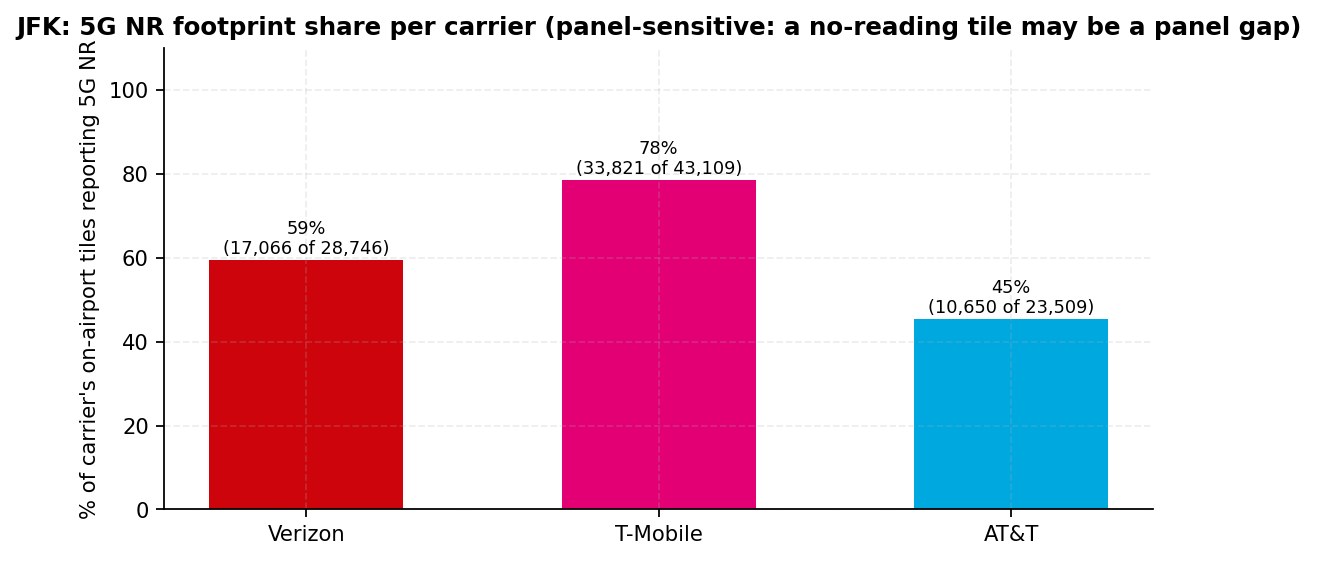
The 5G footprint is the share of a carrier's on-airport tiles that report a 5G NR (New Radio) reading, and it is
panel-sensitive: a no-reading tile may be a panel gap on that carrier. T-Mobile 78%
(33,821 of 43,109 tiles), Verizon 59% (17,066 of 28,746), AT&T 45% (10,650 of 23,509). 53% of AT&T's on-airport tiles carry only an LTE reading, which is
why its LTE median at the gate points (−90.8 dBm) matters more than it does for the other two carriers.
Fig. 15 · 5G footprint · share of tiles with a 5G NR readingSource · Ookla
Footprint counts tiles with a non-null 5G reading. Panel-sensitive. Window 2025-09-01 to 2026-08-31.
Coverage-band attachment
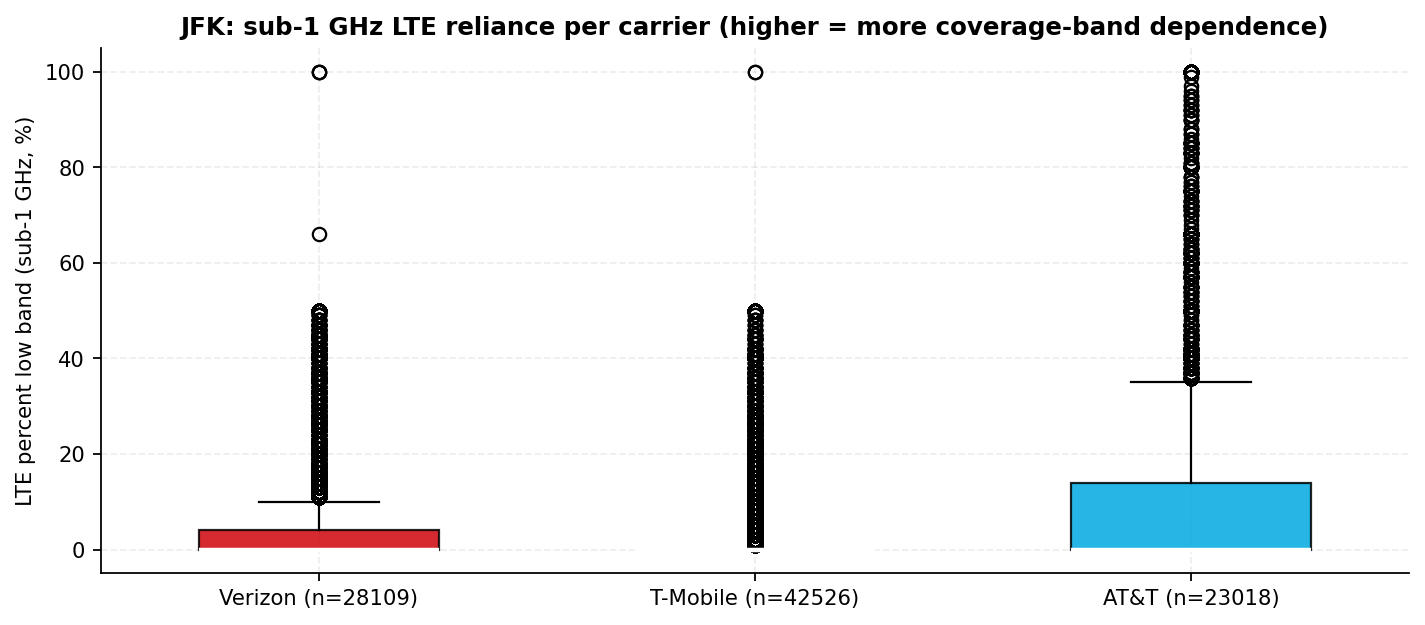
The percent-low-band statistic describes LTE coverage-band attachment. A tile that attaches to sub-1 GHz spectrum
is using a coverage-grade band, which propagation, carrier idle-mode priorities, and site geometry all drive. Verizon
mean 6.5%, median 0% (tiles above zero: 27% of n=28,109) · T-Mobile mean 3.2%, median 0% (tiles above zero: 22% of
n=42,526) · AT&T mean 15.4%, median 0% (tiles above zero: 40% of n=23,018).
The LTE metric does not see 5G low band. On the 5G side: Verizon NR850 on 759 tiles, 13.8% of its 5,506
band-reporting NR tiles. T-Mobile NR600 on 4,273 tiles, 15.5% of its 27,561 band-reporting NR tiles. AT&T NR850 on
95 tiles, 23.2% of its 409 band-reporting NR tiles. LTE700PS, FirstNet Band 14, appears on 509 AT&T LTE tiles.
Cell, PCI, and band fields populate only where Ookla resolved a serving cell, so band n is smaller than RSRP n;
AT&T's NR band mix rests on the 409 tiles where an NR serving cell was resolved and describes a subset.
Fig. 16 · LTE percent-low-band distribution per carrierSource · Ookla
Higher means more attachment to sub-1 GHz coverage bands. Macro-site geometry is queued for the next revision. Window 2025-09-01 to 2026-08-31.
Quality proxies and service availability
Carrier
RSRQ median NR / LTE
LTE CQI median
Optimization priority median
Serving-cell volatility LTE / 5G
General LTE service availability
Verizon
−12.0 / −12.0 dB
7.0n=7,653
60n=23,230
39% / 13%n=26,550 / 5,506
99.8%82% of tiles reporting
T-Mobile
−12.0 / −14.0 dB
8.0n=12,052
62n=28,864
43% / 42%n=35,187 / 27,556
99.5%83% of tiles reporting
AT&T
−12.0 / −13.0 dB
9.0n=6,128
61n=19,041
39% / 3%n=22,559 / 409
98.0%63% of tiles reporting
Tile medians per carrier. CQI (0 to 15) is the closest throughput proxy in an export that carries no throughput fields. Optimization priority is Ookla's vendor-defined index.
Volatility = share of tiles where the strongest observed cell differs from the most-frequent serving cell. Availability is the mean over reporting tiles only.
Inference: an NR serving cell that resolves on 4% of AT&T's 5G tiles is consistent with non-standalone (NSA)
anchoring, where the handset reports the LTE anchor as its serving cell; it would also fit AT&T's 53% LTE-only
share. The export cannot confirm it. AT&T's 5G volatility and PCI diversity therefore describe a 409-tile subset and
are not comparable with the other carriers' bars.
Section 11
Load, density, and Wi-Fi share
Venue and terminal level only
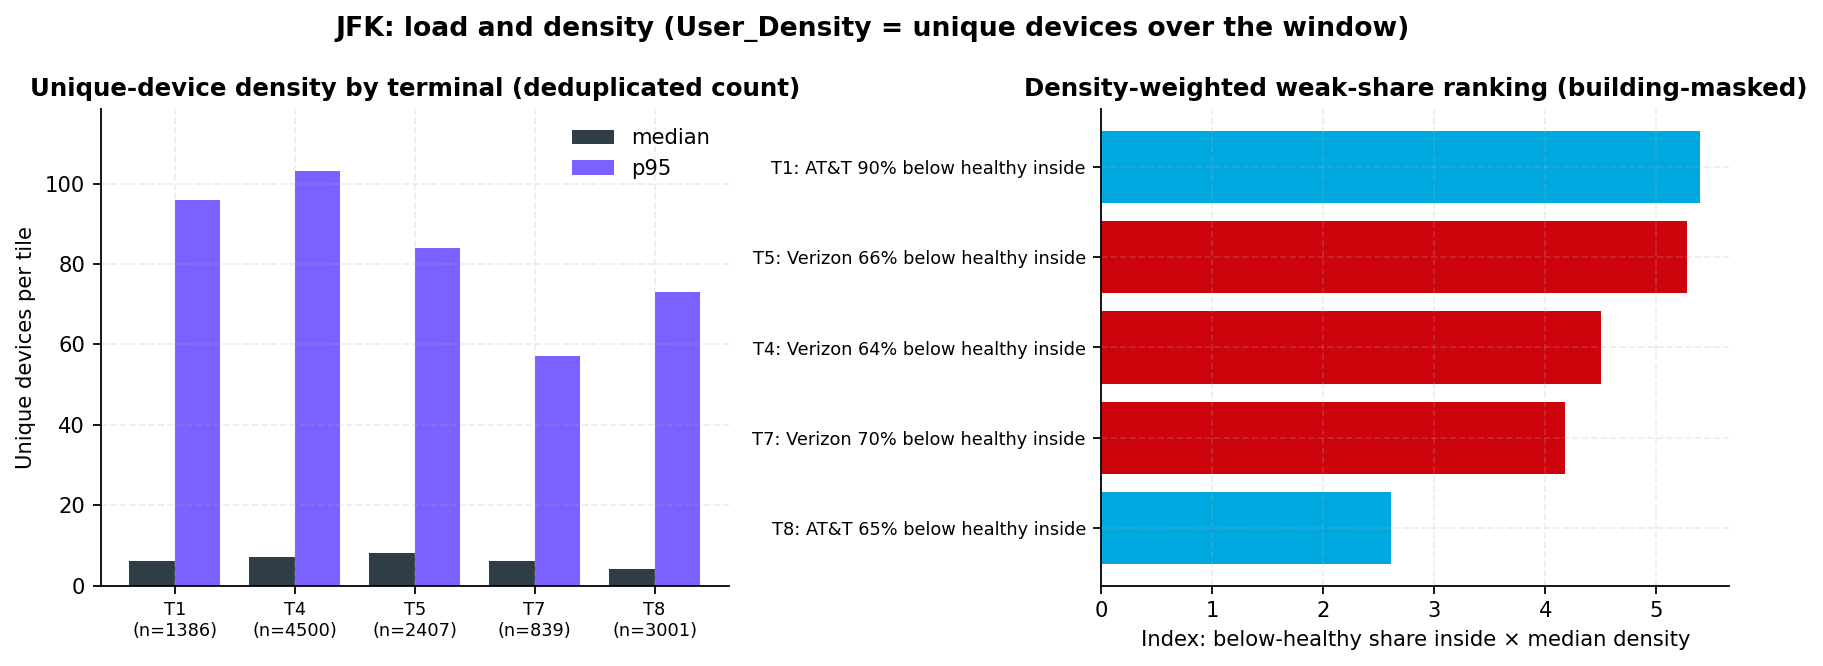
Density is this dataset's demand signal. Ookla's User_Density field counts the unique Android devices observed per
tile over the window, deduplicated. It does not count simultaneous users and it does not measure time spent. Terminal
medians and 95th percentiles (p95) are on the gate-and-concession pool.
Terminal
Median devices per tile
p95
Usage tiles (n)
Weakest carrier inside the footprint
Density- weighted rank
Wi-Fi share of observed volume
Terminal 1
6
96
1,386
AT&T90% below healthy inside
1
61%
Terminal 5
8
84
2,407
Verizon
2
50%
Terminal 4
7
103
4,500
Verizon
3
57%
Terminal 7
6
57
839
Verizon
4
60%
Terminal 8
4
73
3,001
AT&T
5
60%
Venue
3
45
50,663
n/a
n/a
56.2%
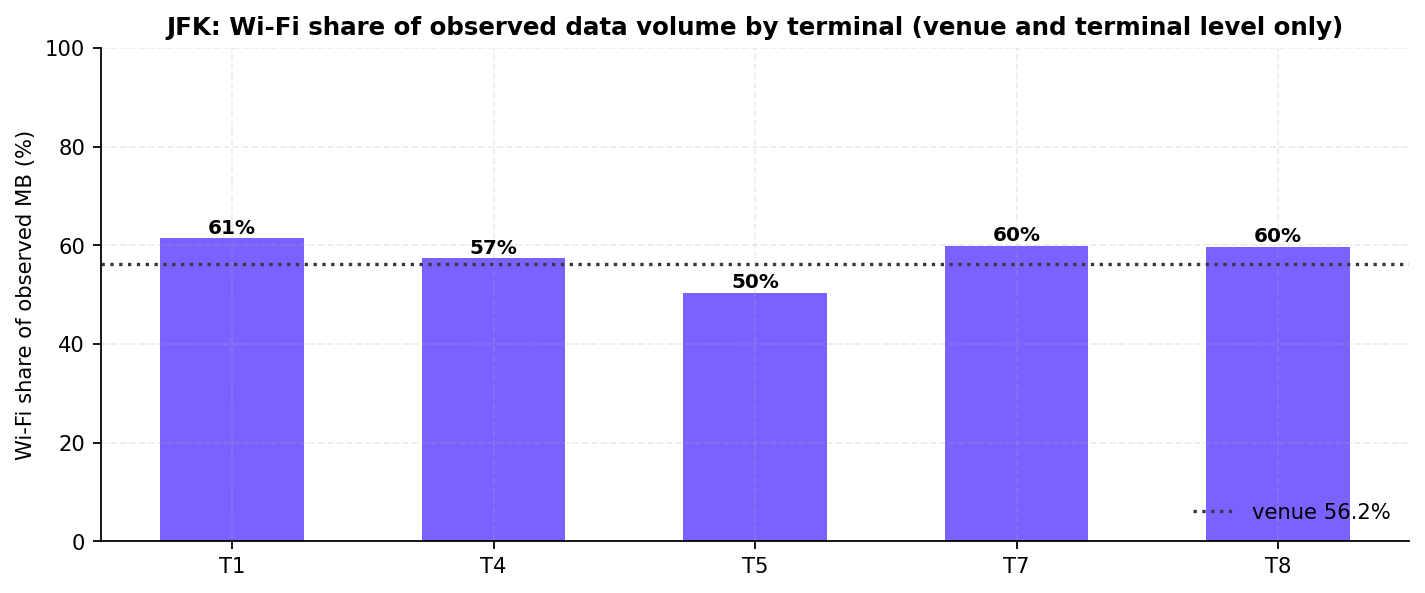
Density-weighted ranking = weakest-carrier below-healthy share inside the footprint (building-masked, conditional) × median density. Wi-Fi share of observed data volume = Σ Wi-Fi MB ÷ Σ (Wi-Fi + mobile) MB on the All Networks panel.
Terminal 1 leads the density-weighted ranking (AT&T below healthy on 90% of its reporting tiles inside, median
density 6). The weakest carrier inside the footprint is AT&T in T1, Verizon in T4, Verizon in T5, Verizon in T7,
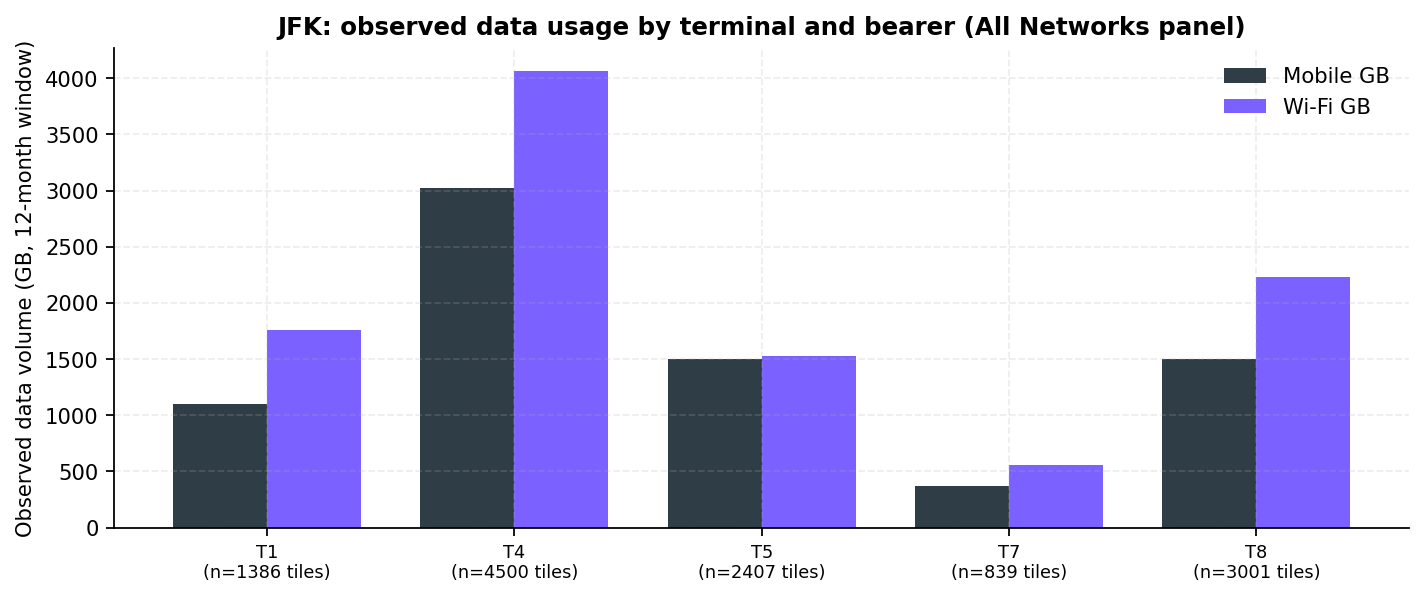
AT&T in T8. The on-airport median is 3 devices per tile across 50,663 usage tiles. Usage volume is observed sample
volume from the crowdsource panel. It is not total traffic.
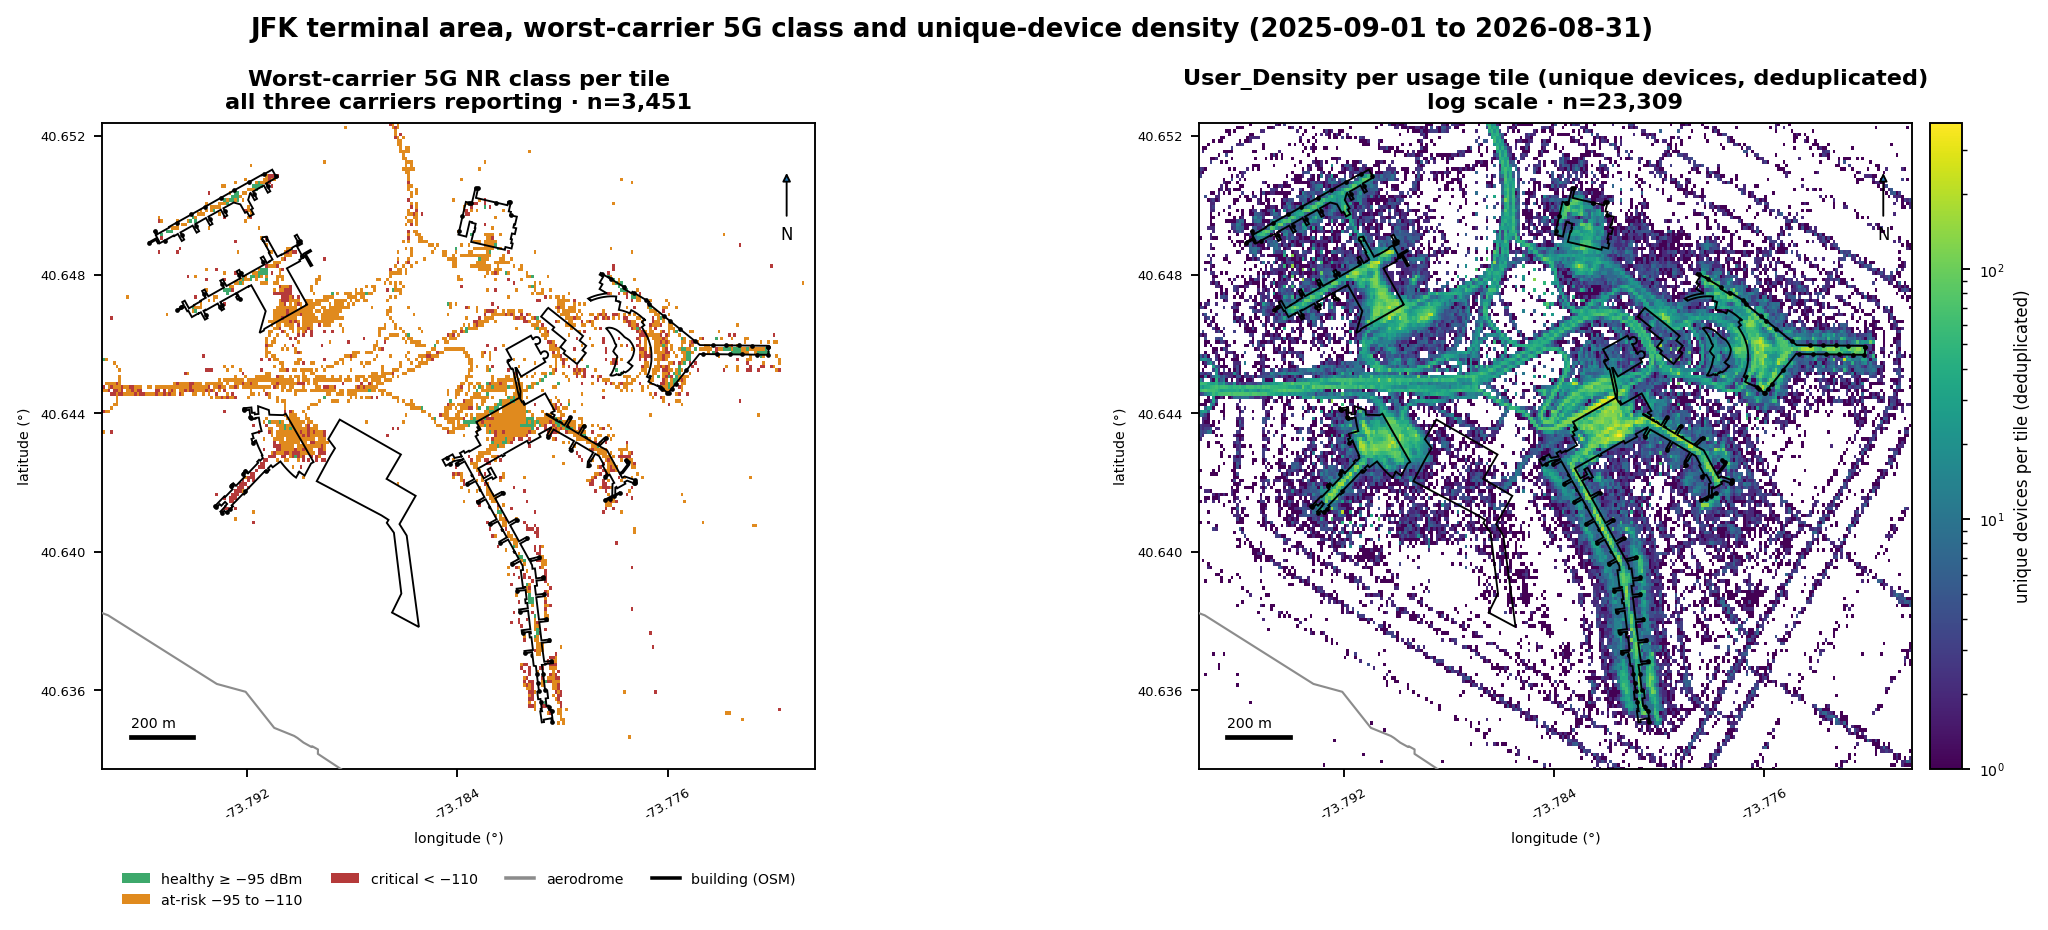
Fig. 17 · Worst-carrier 5G class per tile and unique-device density per tileSource · Ookla
Left: worst-carrier 5G NR class per tile where all three carriers report. Right: User_Density per usage tile, unique devices over the window, deduplicated, log scale. Amber dominates the apron edges on the worst-carrier panel, and the density panel shows the terminal cores and the AirTrain corridor carrying the highest unique-device counts. Source: Ookla Cell Analytics. Window 2025-09-01 to 2026-08-31.
Fig. 18 · Unique-device density by terminal · density-weighted weak-share rankingSource · Ookla
User_Density = unique devices over the window, deduplicated. Density on the gate-and-concession pool; ranking on the building-masked conditional basis. Window 2025-09-01 to 2026-08-31.
Wi-Fi share of observed data volume
Venue-wide, 56.2% of observed data volume moves over Wi-Fi (n=50,663 usage tiles). Terminal shares run from
50% in Terminal 5 to 61% in Terminal 1. Wi-Fi usage is observed on 57% of the 40,920 on-airport usage tiles that
report the Wi-Fi field.
Scope decomposition: tiles assigned to a terminal pool blend to 57.5%; the remaining on-airport tiles (airfield,
roadways, cargo, remote lots) run 54.2% Wi-Fi, pulling the venue figure to 56.2%. A non-reporting tile means no
measurement and is excluded from the denominator; it is not evidence of no Wi-Fi. The augmentation opportunity is
largest where the weakest carrier is weakest inside the building and Wi-Fi presence is high.
Fig. 19 · Observed data volume by terminal and bearerSource · Ookla
Fig. 20 · Wi-Fi share of observed data volume by terminalSource · Ookla
No per-carrier share
The share is computed at venue and terminal level only. The export does not attribute Wi-Fi usage to any cellular
carrier's subscribers, so a per-carrier share is not derivable and not implied. The figure blends the free airport
Wi-Fi (Boingo, section 9) with tenant and personal networks, so it is not the airport
network's share. Controller telemetry would convert presence into capacity.
Section 12
Carrier-asymmetry atlas
Worst-carrier tally per gate point · gate-area basis
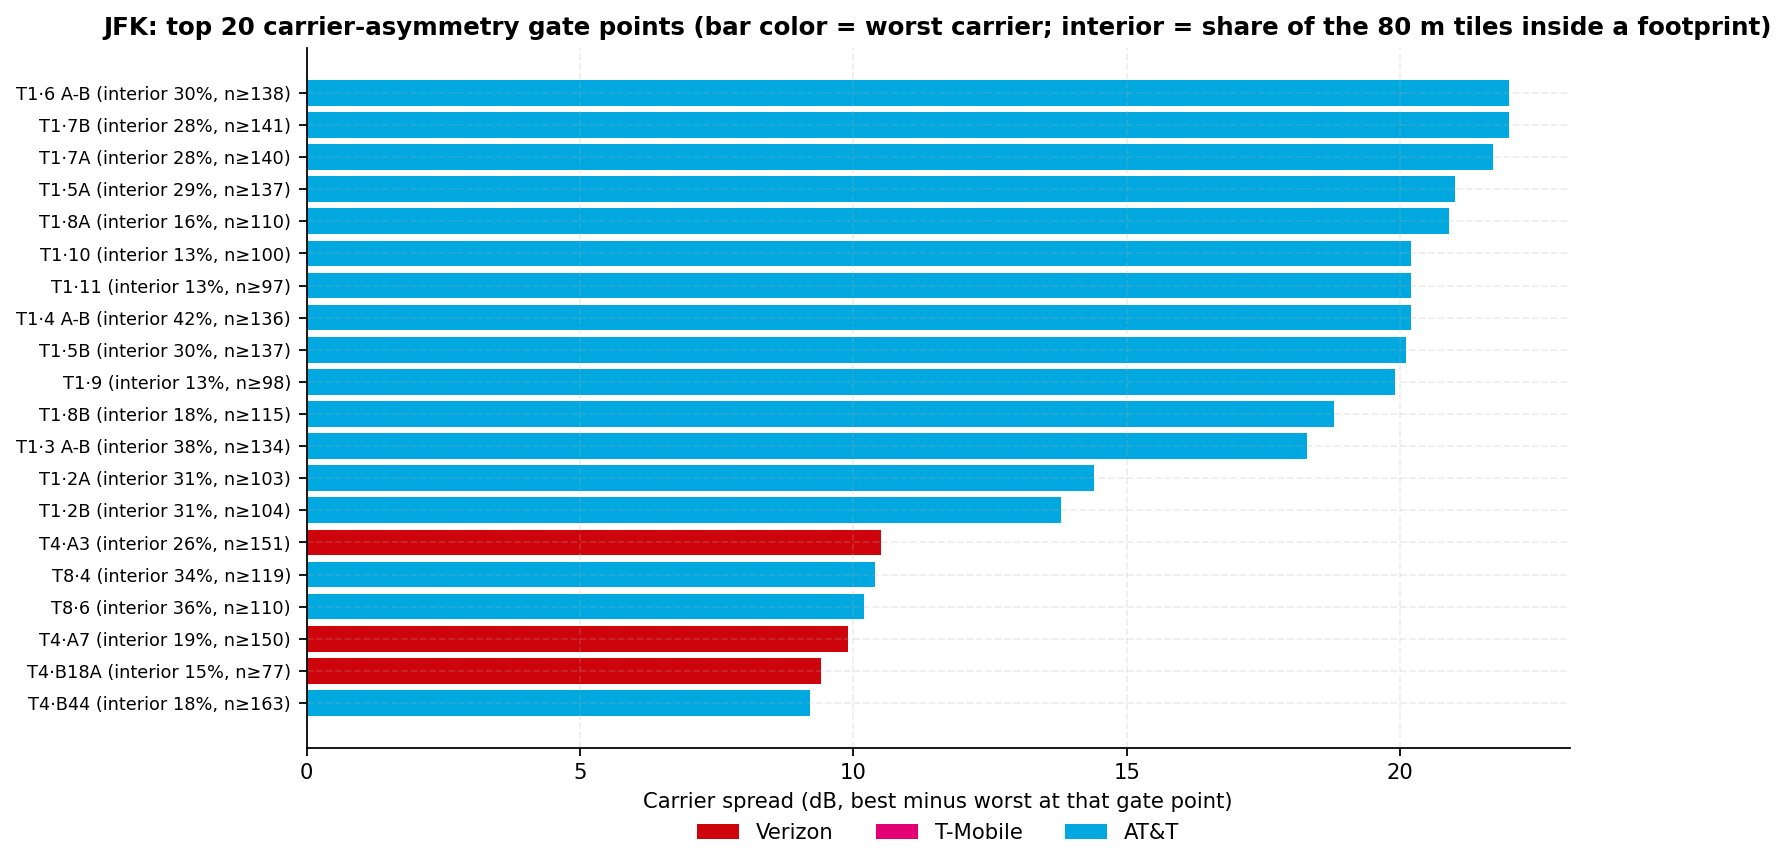
Per gate point, the atlas names the weakest carrier and the spread from the strongest carrier's mean to the
weakest. Worst-carrier tally across all 134 ranked gate points: AT&T 90, Verizon 33, T-Mobile 11. Every
carrier's per-gate n is at least 30 tiles at all 134 gate points, so none are excluded. The top 20 gate points are
where a passenger's experience varies most by carrier on the gate-area basis (spreads of 9 to 22 dB). The largest
spreads sit in Terminal 1 (14 of the top 20); their interior shares average 25%, so they are pier-edge readings. They
serve two purposes: worst-case examples for the stakeholder narrative, and the gate-point validation list for
section 13.
Gate point (OSM ref)
Terminal · airlines (Tier B)
Worst carrier
Spread
Interior share
Min n per carrier
T1 · 6 A-B
T1 · Air France, Korean Air, Lufthansa, SWISS, Turkish Airlines
AT&T
22.0 dB
30%
138
T1 · 7B
T1 · Air France, Korean Air, Lufthansa, SWISS, Turkish Airlines
AT&T
22.0 dB
28%
141
T1 · 7A
T1 · Air France, Korean Air, Lufthansa, SWISS, Turkish Airlines
AT&T
21.7 dB
28%
140
T1 · 5A
T1 · Air France, Korean Air, Lufthansa, SWISS, Turkish Airlines
AT&T
21.0 dB
29%
137
T1 · 8A
T1 · Air France, Korean Air, Lufthansa, SWISS, Turkish Airlines
AT&T
20.9 dB
16%
110
Fig. 21 · Carrier-asymmetry atlas · top 20 gate points by spreadSource · Ookla
Spread = best minus worst carrier mean 5G RSRP at the gate point, among the 134 gate points where every carrier's per-gate n is at least 30 tiles (gate-area basis; interior share on the label). Window 2025-09-01 to 2026-08-31.
Section 13
Recommendations and monitoring criteria
Ordered by impact · each with an owner
Criteria reference the building-masked basis (section 4) and the monitoring table below.
Ask Boingo for the per-terminal coverage map
The sources we hold do not map which terminal buildings ride on Boingo's network versus terminal-operator systems, nor which carriers are on the DAS in each building; ask Boingo for that map, with the phases and go-live dates of the 2025 agreement; every design question below depends on it.
Owner · Port Authority (with Boingo)
Confirm each carrier's participation on the Boingo system per terminal
The building-masked readings (section 9) favor T-Mobile inside every ranked footprint and Verizon at the Terminal
1 gate points, consistent with a close-in or in-building source; Boingo and the carriers can confirm which
carriers are live on the DAS in each building and since when.
Owner · Port Authority with Boingo and the carriers
Write the monitoring criteria into the New Terminal One and Terminal 6 designs
For every hosted carrier, a healthy share of 5G-reporting tiles at or above 90% inside the footprint on a
like-for-like re-measure (this window's best inside any footprint is 82%), and a healthy 5G median at every
interior gate point.
Owner · Port Authority, terminal developers
Scope Terminal 1 and Terminal 7 in-building work to their remaining service life
Inside the Terminal 1 footprint AT&T is healthy on 10% of its 226 reporting tiles (median −109.0 dBm) and New
Terminal One replaces the building (cited source); a like-for-like fix there should be a bridge, not a build.
Owner · Port Authority, terminal operators
Treat Terminal 4 as the priority existing building on the interior re-cut
2 of 3 carriers weak inside the footprint (Verizon, AT&T) on the largest interior tile set (1,973 reporting
tiles across carriers); Terminal 1, Terminal 7, Terminal 8 tie on the weak-carrier count with smaller interior
sets. Its operator (JFKIAT, Tier B) should be the first design partner. The gate-area count (43 of 47 gate points
weak for all three) is an apron-edge reading and is not the justification.
Owner · JFKIAT, Port Authority
Treat Wi-Fi as a coexisting capacity layer in the design
Wi-Fi share of observed data volume 56%, section 11. Obtain controller telemetry to size it, and decide the CBRS
and private-wireless question alongside the neutral-host upgrade (section 9), not after it.
Owner · Port Authority, Boingo, terminal operators
What Imagine Wireless will add next
Re-measure over a like-for-like window after any in-building change goes live
The same 12-month length, or a matched shorter window that is disclosed. Crowdsourced tiles serve as the
before-and-after comparison; acceptance itself is per-carrier commissioning against the same thresholds.
Owner · Imagine Wireless
Pull the queued layers before the next issue
Site Finder centroids, the knowledge-graph contracts and artifact rows, and the Ookla Indoor layer captures. Each
upgrades a named claim from proxy to measurement.
Owner · Imagine Wireless
Reconcile the OpenStreetMap gate inventory against each terminal operator's gate plan
So gate-named criteria carry the operator's labels.
Owner · Imagine Wireless with terminal operators
Post-deployment monitoring criteria
These are monitoring criteria for the before-and-after comparison, not the acceptance test for any system.
Acceptance itself is per-carrier commissioning (walk test and scanner survey) against the same thresholds. Criteria
are stated on the building-masked conditional set (healthy share of 5G-reporting tiles inside each footprint) and on
the 7 gate points whose 80 m tile set is at least 50% inside a footprint; the panel-sensitive present-and-healthy
share is not a criterion. Gate refs come from the OpenStreetMap inventory after the same-ref merge and must be
reconciled against each terminal operator's gate plan before adoption.
Terminal or point
Carrier
Criterion (threshold)
Terminal 4
Verizon
Healthy share of 5G-reporting tiles inside the footprint ≥ 90% (this window: 36% of n=558)
Terminal 4
T-Mobile
Healthy share of 5G-reporting tiles inside the footprint ≥ 90% (this window: 69% of n=885)
Terminal 4
AT&T
Healthy share of 5G-reporting tiles inside the footprint ≥ 90% (this window: 39% of n=530)
Terminal 5
Verizon
Healthy share of 5G-reporting tiles inside the footprint ≥ 90% (this window: 34% of n=385)
Terminal 5
T-Mobile
Healthy share of 5G-reporting tiles inside the footprint ≥ 90% (this window: 70% of n=618)
Terminal 5
AT&T
Healthy share of 5G-reporting tiles inside the footprint ≥ 90% (this window: 60% of n=334)
Terminal 7
Verizon
Healthy share of 5G-reporting tiles inside the footprint ≥ 90% (this window: 30% of n=92)
Terminal 7
T-Mobile
Healthy share of 5G-reporting tiles inside the footprint ≥ 90% (this window: 77% of n=200)
Terminal 7
AT&T
Healthy share of 5G-reporting tiles inside the footprint ≥ 90% (this window: 43% of n=75)
Terminal 8
Verizon
Healthy share of 5G-reporting tiles inside the footprint ≥ 90% (this window: 40% of n=311)
Terminal 8
T-Mobile
Healthy share of 5G-reporting tiles inside the footprint ≥ 90% (this window: 82% of n=521)
Terminal 8
AT&T
Healthy share of 5G-reporting tiles inside the footprint ≥ 90% (this window: 35% of n=311)
T5 gate 507 (interior 52%)
Every carrier
5G RSRP mean of the 80 m tiles ≥ −95 dBm (this window: Verizon −97.6, T-Mobile −91.8, AT&T −98.0 dBm)
T5 gate 522 (interior 53%)
Every carrier
5G RSRP mean of the 80 m tiles ≥ −95 dBm (this window: Verizon −97.7, T-Mobile −93.4, AT&T −95.6 dBm)
T5 gate 523 (interior 51%)
Every carrier
5G RSRP mean of the 80 m tiles ≥ −95 dBm (this window: Verizon −99.2, T-Mobile −93.9, AT&T −94.1 dBm)
T5 gate 524 (interior 50%)
Every carrier
5G RSRP mean of the 80 m tiles ≥ −95 dBm (this window: Verizon −99.6, T-Mobile −94.6, AT&T −94.3 dBm)
T7 gate 7 (interior 59%)
Every carrier
5G RSRP mean of the 80 m tiles ≥ −95 dBm (this window: Verizon −96.6, T-Mobile −92.7, AT&T −98.8 dBm)
T7 gate 10 (interior 57%)
Every carrier
5G RSRP mean of the 80 m tiles ≥ −95 dBm (this window: Verizon −100.9, T-Mobile −96.4, AT&T −98.4 dBm)
T8 gate 12 (interior 50%)
Every carrier
5G RSRP mean of the 80 m tiles ≥ −95 dBm (this window: Verizon −96.9, T-Mobile −89.9, AT&T −98.7 dBm)
All footprints
T-Mobile
LTE RSRP median of reporting tiles in each terminal pool ≥ −95 dBm (T-Mobile is the only carrier whose venue LTE gate-area median is below −95 dBm: −97.3; this window by terminal: T1 −97.0, T4 −97.0, T5 −100.0, T7 −93.0, T8 −98.0 dBm)
Re-test for every row: like-for-like window after go-live, same instrument (Ookla Cell Analytics, identical thresholds). New Terminal One and Terminal 6 enter the footprint set when their OpenStreetMap polygons and gates exist.
Terminal 1 · remaining service life
New Terminal One replaces Terminal 1 cited source. The same criteria apply for as
long as the building operates, and are listed separately so they are not written into a permanent design.
Terminal or point
Carrier
Criterion (threshold)
Terminal 1
Verizon
Healthy share of 5G-reporting tiles inside the footprint ≥ 90% (this window: 49% of n=192)
Terminal 1
T-Mobile
Healthy share of 5G-reporting tiles inside the footprint ≥ 90% (this window: 62% of n=330)
Terminal 1
AT&T
Healthy share of 5G-reporting tiles inside the footprint ≥ 90% (this window: 10% of n=226)
Re-test: like-for-like window while the building operates.
Passenger exposure · quoted as published, not distributed
JFK carried 62.6 million passengers in 2025, a 1.0 percent decrease from its 2024 record of 63.3 million (Port
Authority of New York and New Jersey press release, cited source); the figures are quoted as published and are
two-way passengers, not enplanements. This report does not distribute passengers across gate points: per-gate and
per-terminal volumes are not available to this report, the instrument is a crowdsourced Android panel, and the gate-area tiles straddle
the apron. The exposure statement this export supports: gate points below healthy 5G on the gate-area basis,
Verizon 110 of 134 (82%), T-Mobile 101 of 134 (75%), AT&T 125 of 134 (93%). For scale, the Imagine
knowledge graph records 30,792,806 calendar-year enplanements for JFK (year as recorded in the graph)
Imagine knowledge graph · cited source; enplanements and two-way passengers are different counts
and neither is distributed across gates here.
Section 14
Methodology and audit trail
Thresholds · provenance · reproducibility
Rule
Value
Sample basis
Ookla Cell Analytics: crowdsourced background scans from consumer Android handsets (a panel Ookla characterizes as about 3% of devices; iOS devices are not sampled), aggregated per tile over the 12-month window. Per-carrier RF exports plus one All Networks usage export. The panel's composition differs by carrier, so cross-carrier comparisons inherit a device-population bias this export cannot correct; the 5G footprint share and the present-and-healthy share of all tiles are panel-sensitive and never decide a rank or a criterion.
Tile geometry
0.0001° × 0.0001° tiles, about 8 m by 11 m at 40.6° N. The three carrier panels cover 50,923 unique tile centroids on the airport, 15,753 of them seen by all three carriers; the 95,364 figure counts carrier-tile records. The export holds no per-tile scan count, so every n counts tiles, not scans. The 30-tile floor guards spatial support, not scan volume. No Z-axis.
Threshold ladder
5G NR SS-RSRP and LTE RSRP healthy ≥ −95 dBm · at risk −95 to −110 · critical < −110. 5G SS-SINR healthy ≥ 10 dB, at risk 0 to 10, critical < 0. RSRQ healthy ≥ −10 dB. This is the Imagine Wireless Venue Network Intelligence ladder, locked across venues so reports compare like for like. No client-specified design target was provided; section 5 shows how the gate-area headline moves with the line (−95, −100, −105 dBm).
Gate join and inventory
Tiles within an 80 m radius of the gate point; per-gate values are arithmetic means of the tile dBm values, and medians of those gate means are used at venue and terminal level. Gates come from a pinned OpenStreetMap inventory of 137 nodes; same-ref nodes within 30 m are merged to one gate position (T4 A6 from 3 nodes; T4 A7 from 2 nodes), giving 134 gate points (T1 16, T4 47, T5 29, T7 10, T8 32). Gate-to-terminal attribution: point-in-polygon against the pinned OSM terminal footprints, with a 150 m nearest-footprint fallback for jet-bridge gates mapped outside the outline.
Interior share
The share of a gate point's 80 m unique tile centroids that fall inside any terminal polygon (venue mean 28%; T1 24%, T4 22%, T5 33%, T7 41%, T8 30%). 7 gate points are at or above 50%: T5 507, 522, 523, 524; T7 7, 10; T8 12.
Building-masked basis
Point-in-polygon of tile centroids against the pinned OSM footprints, so it selects tiles over a building, not tiles measured inside it; healthy share is conditional on a 5G reading and the 5G footprint share inside the polygon is printed beside it. Terminal leaders are decided on this basis only. Ookla's native Indoor layer is queued.
Gate-and-concession pool
Nearest gate or tenant point within 80 m; used for zone distributions, PCI, density, and Wi-Fi; never for leadership.
Clip and export extent
KJFK aerodrome polygon (OpenStreetMap way 158042008) plus 200 m; 95,364 carrier-tile records over 50,923 unique tiles retained from 120,686 exported records, 50,663 usage tiles from 65,263. The export rectangle stops at longitude −73.7618, so the aerodrome's eastern strip (the runway 4L/22R end and the east cargo area) carries no tiles; no terminal sits in that strip. The All Networks export was delivered four times with identical content; three duplicates were dropped.
Minimum n and noise floors
No chart or comparative claim ships on fewer than 30 underlying tiles or points; terminals with fewer than 30 gate points and every tenant category report gate or point tallies as counts, not ranked. dB margins under 1 dB and tile-share margins under 5 points are ties.
Metric discipline
Signal-layer only: no throughput, latency, or jitter are in this export and none are claimed. User_Density is the count of unique Android devices observed per tile over the window, deduplicated; it does not count simultaneous users and it does not measure time spent. Wi-Fi share of observed data volume = Σ Wi-Fi MB ÷ Σ (Wi-Fi + Mobile) MB, at venue and terminal level only; a per-carrier share is not derivable and is not implied.
Tenant basis and hygiene
414 mapped venue points from a pinned Google Places (New) and OpenStreetMap capture (345 + 70 points, pinned 2026-09-15; Tier B, points only, no polygons). 137 points sit outside every terminal footprint and more than 400 m from any gate. 1 Google point named after the airport itself was dropped as a pseudo-point; two spellings of the Customs and Border Protection point are displayed under one normalized name; 1 point whose name carries a terminal token that disagrees with the point-derived terminal is flagged and excluded from terminal tallies. No coordinate was edited. 18 lounge points; 7 federal or operational-critical points, reported for scope and not ranked.
Window and freshness
2025-09-01 to 2026-08-31 · issued 2026-09-15 · 15 days at issue, within the 90-day policy.
Provenance tiers
Tier A reproducible from raw exports. Tier B held documents: the Boingo press release of October 14, 2025 (pinned in the build's source folder) establishes Boingo Wireless as the Port Authority's neutral-host DAS and Wi-Fi provider at JFK, and the terminal airline assignments carry capture dates in the provenance manifest. Tier C "cited source": facts from public sources this report does not hold as measurements, tagged inline; "Imagine knowledge graph" marks facts from the pinned Imagine knowledge-graph snapshot and is likewise cited source. The Imagine knowledge graph holds a JFK record, pinned 2026-09-16: large hub, 30,792,806 calendar-year enplanements (year as recorded in the graph), a Boingo neutral-host DAS active since 2026 under a 2026 to 2038 agreement, Boingo Passpoint Wi-Fi, and four Port Authority leadership rows; per-terminal DAS scope and carrier participation are not in the graph; the contracts query and artifact search failed at the pull and stay open in the audit findings.
Photographs
Tier B illustrative material from Wikimedia Commons (CC0, CC BY 4.0, CC BY-SA 4.0, public domain; all captured 2023 or later; resized only); credited on each image. Photographs are not measurements.
Caveats
The dataset is gate-area and public-corridor weighted; it does not cover jet-bridge interiors or baggage corridors. Nothing in this report is measured indoors: there is no Z-axis, and gate values are tiles within 80 m of a point that straddle the apron. PCI diversity, serving-cell volatility, and band distributions are aggregate proxies, not active traces. Engineering inferences about cause are labeled as inferences where they appear.
Queued layers
Ookla Site Finder centroids · Imagine knowledge-graph contracts and artifact rows (profile, deployment, vendor, and leadership rows are pinned 2026-09-16) · Boingo per-terminal coverage map (the section 9 open item; phases and go-live dates of the 2025 agreement) · per-carrier panel composition · tenant attestation for federal facilities · Ookla Indoor layer captures · date-range comparison · per-gate and per-terminal passenger counts · gate plan reconciliation · New Terminal One and Terminal 6 footprints and gates · Wi-Fi controller telemetry · public-safety (NFPA 1221) coverage · walk test of jet bridges, baggage corridors, and construction zones.
Audit trail
Every published measurement is independently recomputed from the raw pinned exports by
validate_jfk_report.py: 90 checks PASS, 26 of 26 Tier-A claims covered. The audit dossier (32-claim
lane-tagged ledger: Tier A 26, Tier B 3, Tier C 3; 47-page PDF; methodology; provenance manifest; findings log) ships with the
verification bundle. No wall-clock call in any pipeline script; require_n called at build; carrier-order assert
present; pinned inputs verify; OSM snapshots pinned; Imagine knowledge-graph snapshot pinned 2026-09-16 (audit
finding F3 closed). A blind cold read by an independent reviewer was completed on 2026-09-15 and its 18
load-bearing dispositions are applied in this issue. Deliverable subject to the two-lane
human review gate; sign-off status accompanies this issue.
Building-masked table: reporting tiles, footprint share, healthy share, median per terminal per carrier; T-Mobile leads 5 of 5
1, 4, 6, 7, 13
JFK1-11
A · metric
Gate-area medians and healthy counts by terminal (T4 n=47, T8 n=32; T1, T5, T7 counts)
6, 7
JFK1-12
A · metric
Terminal vs periphery deltas +3.0 / +1.0 / +4.0 dB (n=5,573/4,979; 9,978/8,609; 4,058/3,270)
8
JFK1-13
A · metric
Wi-Fi share of observed data volume 56.2%; terminals 61 / 57 / 50 / 60 / 60%
11
JFK1-14
A · metric
Wi-Fi presence 57% of 40,920 tiles; density medians and p95 by terminal; density-weighted ranking (T1 first)
11
JFK1-15
A · metric
Determinism and enforcement of the build
14
JFK1-16
A · metric
RSRQ, CQI, optimization priority, serving-cell volatility; AT&T NR serving cell resolved on 409 tiles (NSA-anchoring inference)
10
JFK1-17
A · metric
Retired-technology ride-along fields (dossier only, never rendered)
Not rendered
JFK1-18
B · entity
Terminal-airline assignments
2, 6, 7, 12
JFK1-19
B · entity
Neutral-host provider of record: Boingo Wireless (held press release October 14, 2025; authorized June 26, 2025 under the 2024 RFP; term 2026 to 2038; replaces the 1999 New York Telecom Partners agreement; Passpoint Wi-Fi)
Hero, 1, 2, 9, 11
JFK1-20
C · entity
Construction program facts (New Terminal One, Terminal 6, Terminal 2)
2, 7
JFK1-21
C · entity
Passenger volume, quoted as published: 62.6 million in 2025, a 1.0 percent decrease from 63.3 million
2, 13
JFK1-22
C · entity
Knowledge-graph record (pinned 2026-09-16): large hub; 30,792,806 calendar-year enplanements; Boingo neutral-host DAS and Passpoint rows; four leadership rows; contracts query and artifact search failed
2, 13, 14
JFK1-23
A · metric
Export extent versus aerodrome (east strip unexported; duplicate All Networks exports dropped)
2, 14
JFK1-24
A · interpretation
75 of 134 gate points all-weak on the gate-area basis with 28% mean interior share; no footprint all-weak on the interior re-cut
1, 5, 9
JFK1-25
A · interpretation
In-building signature: T-Mobile inside-footprint medians above its own gate-area medians; Verizon ahead of AT&T at the Terminal 1 gate points
9
JFK1-26
A · metric
Mean interior share by terminal; venue mean 28%; 7 interior gate points (≥ 50%)
1, 4, 5, 13, 14
JFK1-27
A · metric
Coverage-band attachment, FirstNet, service availability; strongest-band rows under 30 tiles suppressed
Tenant capture counts (415 captured, 414 after the pseudo-point drop; 137 outside; 1 flagged; 18 lounge; 7 federal)
2, 14
JFK1-30
A · metric
Sensitivity of the gate-area headline to the healthy line (−95, −100, −105 dBm)
5, 14
JFK1-31
B · entity
Neutral-host DAS agreement record (KG evidence and held press release): term 2026 to 2038; board authorization June 26, 2025 under the 2024 RFP; all Port Authority facilities except the GWB Bus Station and World Trade Center; replaces the 1999 New York Telecom Partners agreement; interim JFK upgrades self-funded pending the agreement